2013年1月31日木曜日

フランス国立薬品安全庁は、ニキビや経口不妊薬のための薬で、4人の人が死亡した可能性の事件により、Bayer社のDaine 35 の販売承認を停止。

EL PAIS

フランス国立薬品安全庁は、ニキビや経口不妊薬のための薬で、4人の人が死亡した可能性の事件により、Bayer社のDaine 35 の販売承認を停止。


Francia paraliza la comercialización de la píldora Diane 35

Las autoridades investigan si el fármaco, para tratar el acné, está vinculado a cuatro muertes


María R. Sahuquillo Madrid 30 ENE 2013 - 17:15 CET


France paralyzed the marketing of the pill Diane 35


Authorities are investigating whether the drug, to treat acne, is linked to four deaths


Mary R. Sahuquillo Madrid 30 ENE 2013 - 17:15 CET


The French National Agency for the Safety of Medicines (MSNA) has suspended the marketing authorization of the pill Diane 35 and all generic. That country is investigating this drug from Bayer laboratory, which is used to treat acne, for their possible connection with the deaths of four women. The French authorities consider that the supposed benefit of this drug for acne-pathology is lower associated risk of venous thromboembolism. Moreover, according to the MSNA, the use of this drug and its effectiveness as a contraceptive "has not been demonstrated with appropriate clinical studies." In fact, the French authorities withdrew in 2005 as the indication pill product.
So, Diane 35 and stop all generic sold in France in three months. Meanwhile, the MSNA asks all women taking these pills that did not stop once, but consult your doctor to discuss birth control options best suited for them.
The decision comes days after the MSNA had been informed of the death of four women for venous thrombosis associated with consumption of 35 or their generic Diane. According to France, the risk of this side effect is four times higher in women taking this drug. The MSNA remember also that this is not a drug that should be used as birth control and that there are alternatives for the treatment of acne.
The French agency has asked also to the European Medicines Agency (EMA) to analyze the drug and its risks. Also review the contraceptive third and fourth generation, posing a higher risk of thromboembolism than first-and second-but guarantee lower metabolic adverse effects, for example -. The EMA will now decide whether it alters the sale of these products in Europe or whether to include more information than is provided for use in their prospectuses.
The pill Diane 35 is approved in 135 countries and marketed in 116. This drug was approved in Spain in 1981 as a contraceptive. That indication was removed in 2002 by studies suggesting an increased risk of thromboembolism than other contraceptives. Now, says a spokeswoman for the Ministry of Health, only indicated for severe cases of acne.
Bayer, the company that sells this pill, said it will work as usual with health authorities to exchange all relevant information regarding the use and benefit-risk profile of the drug, reports Europa Press. From the laboratory for the moment stress, the drug was not removed from any market in 116 countries in which it is marketed.
Risk of stroke
Spanish health authorities for now, they will not take any decision on contraception. Await, like other EU countries, to pronounce, the European Committee for the Pharmacovigilance Risk Assessment of the EMA, which is pending analyze this issue at the request of France in the coming days.
The gynecologist Isabel Serrano, a member of the Spanish Society of Contraception, explains Diane 35 was used a lot during many years in Spain. "But then he was replaced by other modern contraceptives. Later withdrew its indication for contraception because there was evidence that the risk of thromboembolism was higher than with other drugs," he recalls. The family planning expert explains that oral contraceptives have as one of its side effects reported risk causing strokes, but clarifies that pregnancy also favors that risk. Between five and ten per 100,000 women not using oral contraceptives may have a venous thromboembolism, the risk increases to 20 cases per 100,000 women using second-generation to third generation contraceptives the risk of thromboembolism affects between 30 and 40 women in 100,000. The risk of thromboembolism by pregnancy affects 60 out of every 100,000 women.
Serrano argues that France's decision implies no alarm for women. "The risk of stroke in this drug is taken into account when prescribing", follows the gynecologist, explaining further that can not be extrapolated to other contraceptives. "This can not deter women using oral contraceptives. Unable alarm, the risk of thromboembolism is something that is there and to be reckoned with, so doctors must make a good history of the patient and seek for her the method that suits you depending on its features and risks, "he adds.

フランス国立薬品安全庁は、ニキビや経口不妊薬のための薬で、4人の人が死亡した可能性の事件により、Bayer社のDaine 35 の販売承認を停止。
フランスはピルダイアン35のマーケティングを麻痺させ


当局は、薬はにきびの治療に4人の死にリンクされているかどうか調査しています


メアリーR. Sahuquilloマドリード30 ENE 2013 - 17:15 CET
 
医薬品の安全性(MSNA)フランス国立庁はピルダイアン35とすべてのジェネリックの販売承認を停止している。あの国は4人の女性の死亡との可能な接続のために、にきび治療に使われていバイエル研究室からこの薬を調査しています。フランス当局はにきびの病状のために、この薬のはずの利点は、静脈血栓塞栓症の下に関連するリスクであると考えています。また、MSNAによると、この薬と避妊薬としての有効性の使用は、 "適切な臨床試験で実証されていません。"実際には、フランス当局は、指示ピル製品として、2005年に撤退した。
だから、ダイアン35と3ヶ月にフランスで販売されたすべてのジェネリックを停止します。一方、MSNAは一旦停止しなかったこれらの薬を飲んですべての女性を要求しますが、最も適した避妊のオプションを議論するために医師にご相談ください。
MSNAは35の消費又はそれらの総称ダイアンに関連付けられた静脈血栓症の4人の女性の死を知らされた後に決定が日が来る。フランスによると、この副作用のリスクは、この薬を服用している女性で4倍高くなっています。 MSNAは、これは避妊として、にきびの治療のための選択肢があることを使用されるべき薬剤ではないことも覚えておいてください。
フランスの機関は、薬物とそのリスクを分析するために欧州医薬品庁(EMA)にも求めている。また、例えば、第1世代と第2が、保証低い代謝性副作用、より血栓塞栓症のリスクが高いポーズ、避妊、第3および第4世代を見直す - 。 EMAは、今ではヨーロッパで、または彼らの目論見書で使用するために提供されるより多くの情報を含めるかどうか、これらの製品の販売を変化させるかどうかを決定します。
ピルダイアン35は、135カ国で承認され、116で販売されています。この薬は避妊薬として1981年にスペインで承認されました。その表示は、他の避妊よりも血栓塞栓症のリスクの増加を示唆する研究が2002年に削除されました。今、唯一のにきびの重症の場合に適応と保健省の広報担当者は述べています。
バイエル、この錠剤を販売している会社は、それが薬物の使用とベネフィット - リスクプロファイルに関するすべての関連情報を交換するために保健当局と通常どおりに動作しますが言った、ヨーロッパを押して報告します。一瞬のストレスのための実験室から、薬剤は、それが販売されている116の国でどのような市場から削除されませんでした。
脳卒中のリスク
今のスペインの保健当局は、彼らは避妊上の任意の意思決定を取ることはありません。これから数日のうちにフランスの依頼でこの問題を分析する保留されているEMAの医薬品安全性リスク評価のために、欧州委員会を発音する、他のEU諸国と同様に、お待ちしております。
婦人科医イザベルセラーノ、避妊のスペイン語協会のメンバーは、ダイアン35はスペインの多くの年の間に多く使われていた説明しています。 "しかし、その後、彼は他の近代的な避妊に置き換えられました。血栓塞栓症のリスクは他の薬と比べて高かったことを示す証拠があったため、その後は避妊のためにその指示を撤回し、"と彼は回想する。家族計画の専門家は、経口避妊薬は、その副作用の一つは、リスク原因ストロークが報告されているようにありますが、その妊娠はまた、そのようなリスクを明確に支持することを説明しています。 10万人の女性の経口避妊薬を使用していないあたり5と10の間の静脈血栓塞栓症を有することができ、リスクは血栓塞栓症のリスクが30の間に影響を与える第三の第二世代の世代の避妊薬を使用して、10万人の女性当たり20例に増加10万人と40人の女性。妊娠による血栓塞栓症のリスクが10万人女性の60を影響します。
セラーノは、フランスの意思決定は、女性のためのアラームを意味しな​​いと主張している。 "処方する場合、この薬で、脳卒中のリスクが考慮される"、他の避妊に外挿することができないことを説明し、さらに、婦人科医に従います。 "これは、経口避妊薬を使用している女性を抑止することはできません。ませんアラームを、血栓塞栓症のリスクがあると侮れないものであるため、医師は、患者の良い歴史を作り、求めなければならない彼女のために、その機能とリスクに応じてあなたに合った方法が、 "と彼は付け加えた。

2013年1月26日土曜日

スペインの4つの自治州で風邪*インフルエンザ)が流行の範囲圏に突入、Aragon,Asturia, Catalunya, Pais Vasco。Asturia州の風邪発生率は人口10万0000人に付き338'9件、アラゴンは198件、パイスバスコ?は195件、カタルーニャは159件。

EL PAIS

スペインの4つの自治州で風邪*インフルエンザ)が流行の範囲圏に突入、Aragon,Asturia, Catalunya, Pais Vasco。Asturia州の風邪発生率は人口10万0000人に付き338'9件、アラゴンは198件、パイスバスコ?は195件、カタルーニャは159件。

La gripe alcanza niveles de epidemia en cinco autonomías

La mayor incidencia se da en Aragón, Asturias, Cataluña, País Vasco y La Rioja

Hospitales de Barcelona han tenido que reorganizar los servicios por el incremento de pacientes


Jaime Prats Valencia 25 ENE 2013 - 13:43 CET

Con el frío llega la gripe; y con la acumulación de infecciones, la situación de epidemia. Cinco autonomías (Aragón, Asturias, Cataluña, País Vasco y La Rioja) ya han superado el umbral epidémico de la enfermedad, como refleja el último informe del Sistema de Vigilancia de la Gripe, que publica la Red Nacional de Vigilancia Epidemiológica del Instituto de Salud Carlos II, y que ofrece datos de la semana pasada (del 14 al 20 de enero).

La mayor incidencia del virus se da en Asturias, con 338,9 casos por 100.000 habitantes, por delante de Aragón (198) y Canarias (195). Se considera que la gripe ha alcanzado niveles de epidemia cuando se supera la tasa de 66,8 casos por 100.000 habitantes (un listón que se fija a partir de la evolución de la enfermedad a lo largo de las once temporadas precedentes) y los contagios están extendidos de forma homogénea por un territorio.

Una de las comunidades que más problemas asistenciales está teniendo por la extensión de la enfermedad es Cataluña (con una incidencia de 159 casos). Áreas de urgencias de grandes centros de Barcelona como los hospitales Vall d’Hebron o Bellvitge han reorganizado sus servicios para hacer frente al incremento de pacientes. En el caso del Hospital de Bellvitge se ha llegado a suspender intervenciones quirúrgicas no urgentes por la falta de camas debido al incremento de ingresos por la epidemia, según indicó el jueves el Sindicato Metges de Catalunya a Europa Press. El hospital ha negado esta circunstancia: "la actividad programada no ha sufrido ninguna anulación en las últimas 72 horas".

En toda España, el número de casos se ha duplicado respecto a la semana anterior y alcanza los 95,35 por 100.000 habitantes. La presencia de la enfermedad es local en Baleares, Navarra, Ceuta y Melilla, y esporádica en el resto del territorio.

Durante la semana pasada se registró el primer fallecimiento vinculado a la gripe. Se trata de un hombre de 64 años con factores de riesgo previos que se complicaron con el contagio. Se le detectó un virus de tipo B. La enfermedad se relaciona con entre 1.400 y 4.000 muertes al año en España.

Estrictamente, una epidemia no es más que una acumulación de infecciones, aunque coloquialmente se ha usado este término para referirse a la aparición de un patógeno especial. Es lo que sucedió con el temido H1N1 de 2009, que finalmente no ha resultado ser tan agresivo como se creía. Existen dos grandes familias del virus de la gripe: el A y el B, con distintos subtipos. El circulante en la actualidad es mayoritariamente del tipo B (el 66%), excepto en Madrid, Ceuta y Murcia. Del 24% restante de gripe de tipo A, un 86% corresponde al subtipo H1N1.


\\\\\\\\\\\\\\\\\\\\\\\\\\\\\\\\\\\\\\\\\\\\\\\\\\\\\\\\\\\\\\\\\\\\\\\\\\\\\\\\\\\\\\\\\\\\\\\\\\\\\\\\\\\\\\


The flu reached epidemic levels in five autonomies


The highest incidence occurs in Aragon, Asturias, Catalonia, Basque Country and La Rioja

Barcelona hospitals have had to reorganize services by increasing patients


Jaime Prats Valencia 25 ENE 2013 - 13:43 CET


With the cold comes the flu, and the accumulation of infections, the epidemic situation. Five autonomies (Aragon, Asturias, Catalonia, Basque Country and La Rioja) have already exceeded the epidemic threshold of disease, as reflected in the latest report of the System Influenza Surveillance, published by the National Epidemiological Surveillance Network Health Institute Charles II, and offers data last week (from 14 to 20 January).
The highest incidence of the virus occurs in Asturias, with 338.9 cases per 100,000 population, ahead of Aragon (198) and the Canaries (195). Flu is considered to have reached epidemic levels when the rate exceeds 66.8 cases per 100,000 population (a fixing strip from disease progression along eleven previous seasons) and infections are spread evenly over a territory.
One of the communities that care is having more problems for the extent of disease is Catalonia (with an incidence of 159 cases). Emergency departments of large centers of Barcelona and Vall d'Hebron hospital or Bellvitge have reorganized their services to cope with the increase in patients. For Bellvitge Hospital has come to suspend non-emergency surgeries due to lack of beds due to increased revenues from the epidemic, said on Thursday the Union Metges de Catalunya Europa Press. The hospital has denied this fact: "the scheduled activity has not suffered any nullification in the last 72 hours."
In Spain, the number of cases has doubled over the previous week and reaches 95.35 per 100,000. The presence of the disease is local in Baleares, Navarra, Ceuta and Melilla, and sporadically in the rest of the territory.
Last week we recorded the first death linked to flu. This is a 64 year old man with previous risk factors that were complicated by infection. He detected a virus type B. The disease is related to between 1,400 and 4,000 deaths per year in Spain.
Strictly, epidemic is simply an accumulation of infection, although this has been used colloquially to refer to the term occurrence of a particular pathogen. This is what happened with the dreaded H1N1 2009, which finally proved to be as aggressive as believed. There are two main families of influenza virus: A and B, with different subtypes. The currently circulating is mostly the type B (66%), except in Madrid, Ceuta and Murcia. The remaining 24% of influenza A, 86% corresponds to the subtype H1N1.

スペインの4つの自治州で風邪*インフルエンザ)が流行の範囲圏に突入、Aragon,Asturia, Catalunya, Pais Vasco。Asturia州の風邪発生率は人口10万0000人に付き338'9件、アラゴンは198件、パイスバスコ?は195件、カタルーニャは159件。


インフルエンザは5自治体での流行レベルに達し


最高の発生率は、アラゴン、アストゥリアス、カタルーニャ、バスク、ラ·リオハで発生

バルセロナの病院が増えて患者さんにサービスを再編成しなければならなかった


ハイメPratsのバレンシア25 ENE 2013 - 13:43 CET
 
風邪とインフルエンザ、感染症の蓄積、流行状況が来る。システムインフルエンザサーベイランスの最新の報告書に反映されるように五自治体(アラゴン、アストゥリアス、カタルーニャ、バスク、ラ·リオハ)はすでにサーベイランスネットワーク保健研究所が公表して、病気の流行がしきい値を超えたチャールズIIは、(14〜20月)先週データを提供しています。
ウイルスの最も高い発生率は、先アラゴン(198)とカナリア諸島(195)の、人口10万人当たり338.9例と、アストゥリアスで発生します。率は人口10万人当たり66.8例(11前の季節に沿って疾患の進行から固定ストリップ)と感染症をアール超えたときインフルエンザが流行レベルに達したとみなされ領土に均等に分散。
ケアは疾患の程度のためのより多くの問題を抱えていることを社会の一つはカタルーニャ(159例発生率)です。バルセロナとヴァルドールヘブロン病院やBellvitgeの大型センターの救急部門​​では、患者の増加に対応できるようにサービスを再編成した。 Bellvitge病院の流行から増収のためのベッドが不足しているため、非緊急手術を中断するようになってきた、ユニオン·デ·カタルーニャMetgesエウロパプレスが明らかにした。病院はこの事実を否定している: "スケジュールされたアクティビティは最後の72時間内の任意の無効化を被っていない"と述べた。
スペインでは、例数は、前の週で倍増し、10万人当たり95.35に到達しました。病気の存在は、バレアレス、ナバラ、セウタとメリリャのローカル、散発的に領土の残りの部分である。
先週、私たちはインフルエンザに連結した第一の死を記録した。これは、感染を合併していた前の危険因子を有する64歳の男性です。彼はウイルスB型が検出されこの疾患は、スペインでは年間1400〜4000人が死亡と関連しています。
これは特定の病原体の用語のオカレンスを参照するのに口語で使われてきたが、厳密に言えば、流行は、単に感染症の蓄積である。これは、最終的に信じほどアグレッシブであることが判明した恐ろしい(H1N1)2009と何が起こったのです。 AとBは、異なるサブタイプを持つ:インフルエンザウイルスの主な2つの家族が暮らしている。現在循環マドリード、セウタとムルシアの場合を除き、ほとんどがB型(66%)である。インフルエンザの残りの24%、86%がサブタイプH1N1に対応しています。

2013年1月6日日曜日

スペインの2012年第51週(12月17日ー12月23日)のインフルエンザ(風邪)感染状況週間報告

スペインの2012年第51週(12月17日ー12月23日)のインフルエンザ(風邪)感染状況週間報告

http://www.isciii.es/ISCIII/es/contenidos/fd-servicios-cientifico-tecnicos/fd-vigilancias-alertas/fd-enfermedades/fd-gripe/fd-informes-semanales-vigilancia-gripe/grn5112.pdf

スペインの2012年/2013年のインフルエンザ(風邪)感染状況週間報告

Instituto de salud Carlos III

スペインの2012年/2013年のインフルエンザ(風邪)感染状況週間報告

Informes Semanales de Temporada 2012/2013

http://www.isciii.es/ISCIII/es/contenidos/fd-servicios-cientifico-tecnicos/fd-vigilancias-alertas/fd-enfermedades/fd-gripe/fd-informes-semanales-vigilancia-gripe/informes-semanales-vigilancia-gripe-temp2012-13.shtml

Informes semanales de vigilancia de la gripe Temporada 2012-13

アメリカ合衆国の2012年第52週12月23日ー12月29日のインフルエンザ(風邪)感染状況

CDC
Centers for Disease Control and Prevention in the United states

アメリカ合衆国の2012年第52週12月23日ー12月29日のインフルエンザ(風邪)感染状況

FluView

A weekly Influenza Surveillance Report 2012 /2013 Influenza season

Week 52 (Dcember 23) ending December 29, 2012

http://www.cdc.gov/flu/weekly/

2012-2013 Influenza Season Week 52 ending December 29, 2012


All data are preliminary and may change as more reports are received.

Synopsis:

During week 52 (December 23-29), influenza activity increased in the U.S.
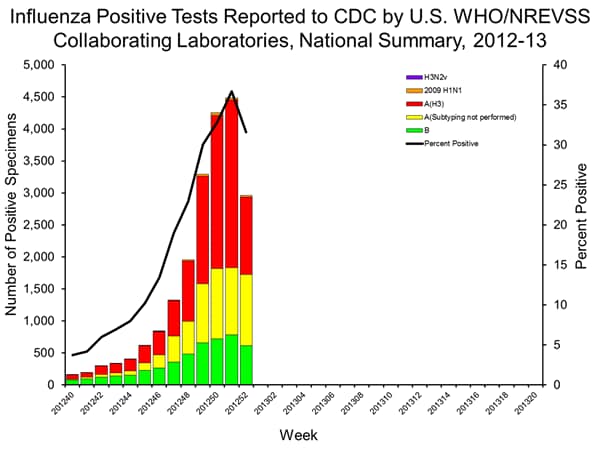
  • Viral Surveillance: Of 9,363 specimens tested and reported by U.S. World Health Organization (WHO) and National Respiratory and Enteric Virus Surveillance System (NREVSS) collaborating laboratories, 2,961 (31.6%) were positive for influenza.
  • Pneumonia and Influenza Mortality: The proportion of deaths attributed to pneumonia and influenza (P&I) was below the epidemic threshold.
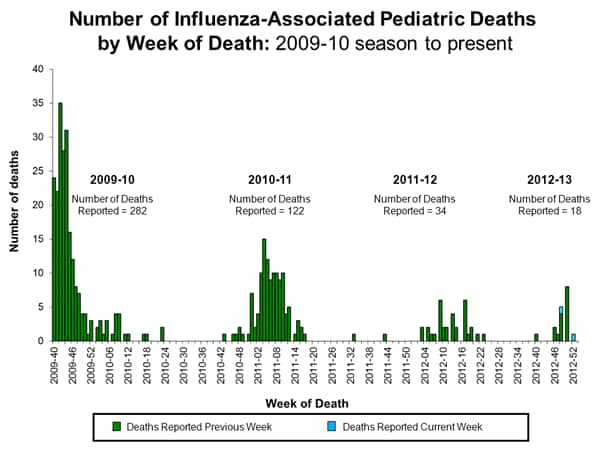
  • Influenza-Associated Pediatric Deaths: Two influenza-associated pediatric deaths were reported and were associated with influenza B viruses.
  • Outpatient Illness Surveillance: The proportion of outpatient visits for influenza-like illness (ILI) was 5.6%; above the national baseline of 2.2%. Nine of 10 regions reported ILI above region-specific baseline levels. New York City and 29 states experienced high ILI activity; 9 states experienced moderate ILI activity; 4 states experienced low ILI activity; 6 states experienced minimal ILI activity, and the District of Columbia and 2 states had insufficient data.
  • Geographic Spread of Influenza: Forty-one states reported widespread geographic influenza activity; 7 states reported regional activity; the District of Columbia reported local activity; 1 state reported sporadic activity; Guam reported no influenza activity, and Puerto Rico, the U.S. Virgin Islands, and 1 state did not report.
A description of surveillance methods is available at: http://www.cdc.gov/flu/weekly/overview.htm

National and Regional Summary of Select Surveillance Components

HHS Surveillance Regions*Data for current weekData cumulative since September 30, 2012 (Week 40)
Out-patient ILI†% positive for flu‡Number of jurisdictions reporting regional or widespread activity§2009 H1N1A (H3)A(Subtyping not performed)BPediatric Deaths
NationElevated31.6%48 of 5419410,6125,6215,62118
Region 1Elevated45.3%6 of 618850204591
Region 2Elevated36.6%2 of 4217226831613
Region 3Elevated43.3%4 of 6371,6881051710
Region 4Elevated28.3%8 of 8201,4103,3681,0584
Region 5Elevated58.4%6 of 6291,9851744175
Region 6Elevated24.7%5 of 575995299714
Region 7Elevated33.9%4 of 428681734220
Region 8Elevated30.3%6 of 6259402971,1740
Region 9Normal22.9%3 of 532599581370
Region 10Elevated31.5%4 of 43951301381
*HHS regions (Region 1 CT, ME, MA, NH, RI, VT; Region 2: NJ, NY, Puerto Rico, US Virgin Islands; Region 3: DE, DC, MD, PA, VA, WV; Region 4: AL, FL, GA, KY, MS, NC, SC, TN; Region 5: IL, IN, MI, MN, OH, WI; Region 6: AR, LA, NM, OK, TX; Region 7: IA, KS, MO, NE; Region 8: CO, MT, ND, SD, UT, WY; Region 9: AZ, CA, Guam, HI, NV; and Region 10: AK, ID, OR, WA).
† Elevated means the % of visits for ILI is at or above the national or region-specific baseline
‡ National data are for current week; regional data are for the most recent three weeks
§ Includes all 50 states, the District of Columbia, Guam, Puerto Rico, and U.S. Virgin Islands


U.S. Virologic Surveillance:

WHO and NREVSS collaborating laboratories located in all 50 states and Puerto Rico report to CDC the number of respiratory specimens tested for influenza and the number positive by influenza virus type and influenza A virus subtype. Region specific data can be found at http://gis.cdc.gov/grasp/fluview/fluportaldashboard.html.
Week 52
No. of specimens tested9,363
No. of positive specimens (%)2,961 (31.6%)
Positive specimens by type/subtype
Influenza A2,346 (79.2%)
2009 H1N1 25 (1.1%)
Subtyping not performed 1,112 (47.4%)
H3 1,209 (51.5%)
Influenza B615 (20.8%)


INFLUENZA Virus Isolated
View National and Regional Level Graphs and Data | View Chart Data | View Full Screen | View PowerPoint Presentation Microsoft PowerPoint file


Since the start of the season, influenza A (H3N2) viruses have predominated nationally, followed by influenza B viruses, while 2009 H1N1 viruses have been identified rarely. The predominant circulating virus has varied by state and by region.


Antigenic Characterization:

CDC has antigenically characterized 413 influenza viruses [17 2009 H1N1 viruses, 281 influenza A (H3N2) viruses, and 115 influenza B viruses] collected by U.S. laboratories since October 1, 2012.
2009 H1N1 [17]:
  • • All 17 2009 H1N1 viruses tested were characterized as A/California/7/2009-like, the influenza A (H1N1) component of the 2012-2013 influenza vaccine for the Northern Hemisphere.
Influenza A (H3N2) [281]:
  • 279 (99.3%) of the 281 H3N2 influenza viruses tested have been characterized as A/Victoria/361/2011-like, the influenza A (H3N2) component of the 2012-2013 Northern Hemisphere influenza vaccine.
  • 2 (0.7%) of the 281 H3N2 viruses tested showed reduced titers with antiserum produced against A/Victoria/361/2011.
Influenza B (B/Yamagata/16/88 and B/Victoria/02/87 lineages) [115]:
  • Yamagata Lineage [79]: 79 (68.7%) of the 115 influenza B viruses tested so far this season have been characterized as B/Wisconsin/1/2010-like, the influenza B component of the 2012-2013 Northern Hemisphere influenza vaccine.

  • Victoria Lineage [36]: 36 (31.3%) of 115 influenza B viruses tested have been from the B/Victoria lineage of viruses.

Antiviral Resistance:

Testing of 2009 H1N1, influenza A (H3N2), and influenza B virus isolates for resistance to neuraminidase inhibitors (oseltamivir and zanamivir) is performed at CDC using a functional assay. Additional 2009 influenza A (H1N1) clinical samples are tested for a single mutation in the neuraminidase of the virus known to confer oseltamivir resistance (H275Y). The data summarized below combine the results of both testing methods. These samples are routinely obtained for surveillance purposes rather than for diagnostic testing of patients suspected to be infected with antiviral-resistant virus.
High levels of resistance to the adamantanes (amantadine and rimantadine) persist among 2009 influenza A (H1N1) and A (H3N2) viruses (the adamantanes are not effective against influenza B viruses). As a result, data from adamantane resistance testing are not presented below.

Neuraminidase Inhibitor Resistance Testing Results on Samples Collected Since October 1, 2012

OseltamivirZanamivir
Virus Samples tested (n)Resistant Viruses, Number (%)Virus Samples tested (n)Resistant Viruses, Number (%)
Influenza A (H3N2)5260 (0.0)5260 (0.0)
Influenza B2260 (0.0)2260 (0.0)
2009 H1N1390 (0.0)300 (0.0)


The majority of currently circulating influenza viruses are susceptible to the neuraminidase inhibitor antiviral medications oseltamivir and zanamivir; however, rare sporadic cases of oseltamivir-resistant 2009 H1N1 and A (H3N2) viruses have been detected worldwide. Antiviral treatment with oseltamivir or zanamivir is recommended as early as possible for patients with confirmed or suspected influenza who have severe, complicated, or progressive illness; who require hospitalization; or who are at greater risk for serious influenza-related complications. Additional information on recommendations for treatment and chemoprophylaxis of influenza virus infection with antiviral agents is available at http://www.cdc.gov/flu/antivirals/index.htm.


Novel Influenza A Virus:

No new human infections with novel influenza A viruses were reported to CDC during week 52.
A total of 312 infections with variant influenza viruses (308 H3N2v viruses, 3 H1N2v viruses, and 1 H1N1v virus) have been reported from 11 states since July 2012. More information about H3N2v infections can be found at http://www.cdc.gov/flu/swineflu/h3n2v-cases.htm.


Pneumonia and Influenza (P&I) Mortality Surveillance:

During week 52, 7.0% of all deaths reported through the 122 Cities Mortality Reporting System were due to P&I. This percentage was below the epidemic threshold of 7.1% for week 52.
Pneumonia And Influenza Mortality
View Full Screen | View PowerPoint Presentation Microsoft PowerPoint file


Influenza-Associated Pediatric Mortality:

Two influenza-associated pediatric deaths were reported to CDC during week 52 and were associated with influenza B viruses. One death occurred during week 48 (week ending December 1) and one death occurred during week 52 (week ending December 29). This brings the total number of influenza-associated pediatric deaths reported during the 2012-2013 season to 18. Additional data can be found at http://gis.cdc.gov/GRASP/Fluview/PedFluDeath.html.


Click on image to launch interactive tool
View Interactive Application | View Full Screen | View PowerPoint Presentation Microsoft PowerPoint file


Influenza-Associated Hospitalizations:

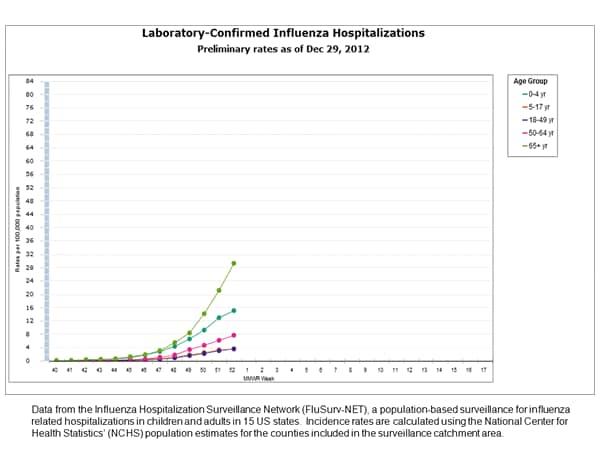
The Influenza Hospitalization Surveillance Network (FluSurv-NET) conducts population-based surveillance for laboratory-confirmed influenza-related hospitalizations in children younger than 18 years of age (since the 2003-2004 influenza season) and adults (since the 2005-2006 influenza season).
The FluSurv-NET covers more than 80 counties in the 10 Emerging Infections Program (EIP) states (CA, CO, CT, GA, MD, MN, NM, NY, OR, TN) and additional Influenza Hospitalization Surveillance Project (IHSP) states. The IHSP began during the 2009-2010 season to enhance surveillance during the 2009 H1N1 pandemic. IHSP sites included IA, ID, MI, OK and SD during the 2009-2010 season; ID, MI, OH, OK, RI, and UT during the 2010-2011 season; MI, OH, RI, and UT during the 2011-2012 season; and IA, MI, OH, RI, and UT during the 2012-2013 season. Data gathered are used to estimate age-specific hospitalization rates on a weekly basis, and describe characteristics of persons hospitalized with severe influenza illness. The rates provided are likely to be an underestimate as influenza-related hospitalizations can be missed, either because testing is not performed, or because cases may be attributed to other causes of pneumonia or other common influenza-related complications.
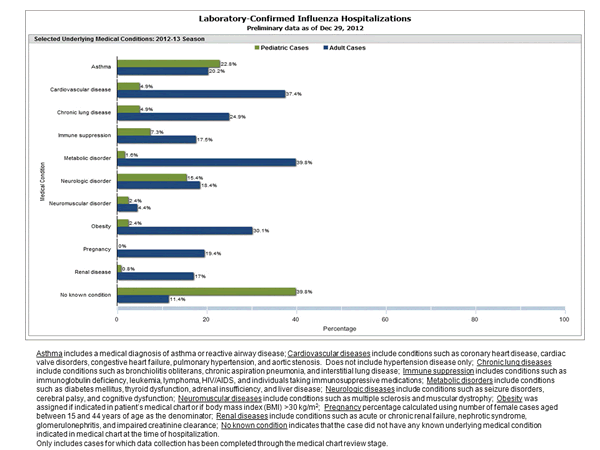
Between October 1, 2012 and December 29, 2012, 2,257 laboratory-confirmed influenza-associated hospitalizations were reported. This is a rate of 8.1 per 100,000 population. Among all hospitalizations, 1,924 (85.2%) were associated with influenza A and 312 (13.8%) with influenza B. There was no virus type information for 19 (0.8%) hospitalizations. Among hospitalizations with influenza A subtype information, 475 (98.1%) were attributed to H3 and 9 (1.9%) were attributed to 2009 H1N1. The most commonly reported underlying medical conditions among hospitalized adults were metabolic conditions, cardiovascular disease, obesity, and chronic lung disease (excluding asthma). Among 36 hospitalized women of childbearing age (15-44 years), seven were pregnant. The most commonly reported underlying medical conditions in hospitalized children were asthma, neurologic disorders, and immune suppression. Approximately 40% of hospitalized children had no identified underlying medical conditions. Additional FluSurv-NET data can be found at: http://gis.cdc.gov/GRASP/Fluview/FluHospRates.html and http://gis.cdc.gov/grasp/fluview/FluHospChars.html.


Click on graph to launch interactive tool
View Interactive Application | View Full Screen | View PowerPoint Presentation Microsoft PowerPoint file


Outpatient Illness Surveillance:

Nationwide during week 52, 5.6% of patient visits reported through the U.S. Outpatient Influenza-like Illness Surveillance Network (ILINet) were due to influenza-like illness (ILI). This percentage is above the national baseline of 2.2%. This increase may be attributed in part to a reduced number of routine health care visits during the Christmas holidays, which has been observed in previous seasons. (ILI is defined as fever (temperature of 100°F [37.8°C] or greater) and cough and/or sore throat.) Region specific data is available at http://gis.cdc.gov/grasp/fluview/fluportaldashboard.html.
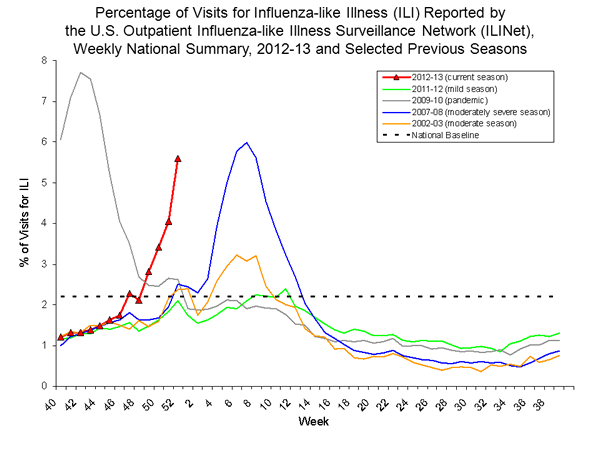
national levels of ILI and ARI
View National and Regional Level Graphs and Data | View Chart Data | View Full Screen | View PowerPoint Presentation Microsoft PowerPoint file


On a regional level, the percentage of outpatient visits for ILI ranged from 2.0% to 9.1% during week 52. Nine regions (Regions 1-8 and 10) reported a proportion of outpatient visits for ILI above their region-specific baseline levels.


ILINet Activity Indicator Map:

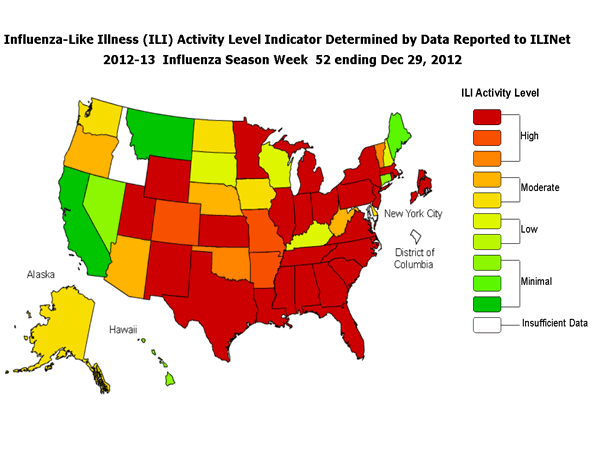
Data collected in ILINet are used to produce a measure of ILI activity* by state. Activity levels are based on the percent of outpatient visits in a state due to ILI and are compared to the average percent of ILI visits that occur during spring and fall weeks with little or no influenza virus circulation. Activity levels range from minimal, which would correspond to ILI activity from outpatient clinics being below the average, to high, which would correspond to ILI activity from outpatient clinics being much higher than average.
During week 52, the following ILI activity levels were experienced:
  • New York City and 29 states experienced high ILI activity (Alabama, Arkansas, Colorado, Florida, Georgia, Illinois, Indiana, Kansas, Louisiana, Massachusetts, Michigan, Minnesota, Mississippi, Missouri, New Jersey, New Mexico, New York, North Carolina, Ohio, Oklahoma, Pennsylvania, Rhode Island, South Carolina, Tennessee, Texas, Utah, Vermont, Virginia, and Wyoming).
  • Nine states experienced moderate ILI activity (Alaska, Arizona, Delaware, Iowa, Nebraska, North Dakota, Oregon, Washington, and West Virginia).
  • Four states experienced low ILI activity (Kentucky, New Hampshire, South Dakota, and Wisconsin).
  • Six states experienced minimal ILI activity (California, Connecticut, Hawaii, Maine, Montana, and Nevada).
  • Data were insufficient to calculate an ILI activity level for the District of Columbia and 2 states (Idaho and Maryland).
Click on map to launch interactive tool


*This map uses the proportion of outpatient visits to health care providers for influenza-like illness to measure the ILI activity level within a state. It does not, however, measure the extent of geographic spread of flu within a state. Therefore, outbreaks occurring in a single city could cause the state to display high activity levels.
Data collected in ILINet may disproportionately represent certain populations within a state, and therefore, may not accurately depict the full picture of influenza activity for the whole state.
Data displayed in this map are based on data collected in ILINet, whereas the State and Territorial flu activity map are based on reports from state and territorial epidemiologists. The data presented in this map is preliminary and may change as more data is received.
Differences in the data presented here by CDC and independently by some state health departments likely represent differing levels of data completeness with data presented by the state likely being the more complete.


Geographic Spread of Influenza as Assessed by State and Territorial Epidemiologists:

The influenza activity reported by state and territorial epidemiologists indicates geographic spread of influenza viruses, but does not measure the severity of influenza activity.
During week 52, the following influenza activity was reported:
  • Widespread influenza activity was reported by 41 states (Alabama, Alaska, Arkansas, Colorado, Connecticut, Florida, Georgia, Kentucky, Idaho, Illinois, Indiana, Iowa, Kansas, Louisiana, Maine, Maryland, Massachusetts, Michigan, Minnesota, Mississippi, Nebraska, Nevada, New Hampshire, New Jersey, New Mexico, New York, North Carolina, North Dakota, Ohio, Oklahoma, Pennsylvania, South Carolina, Rhode Island, Tennessee, Texas, Utah, Vermont, Virginia, West Virginia, Wisconsin, and Wyoming).
  • Regional influenza activity was reported by 7 states (Arizona, California, Missouri, Montana, Oregon, South Dakota, and Washington).
  • The District of Columbia reported local influenza activity.
  • Sporadic influenza activity was reported by 1 state (Hawaii).
  • Guam reported no influenza activity.
  • Puerto Rico, the U.S. Virgin Islands, and 1 state (Delaware) did not report.


Additional National and International Influenza Surveillance Information


FluView Interactive: This season, FluView includes enhanced web-based interactive applications that can provide dynamic visuals of the influenza data collected and analyzed by CDC. These FluView Interactive applications allow people to create customized, visual interpretations of influenza data, as well as comparisons across flu seasons, regions, age groups and a variety of other demographics. To access these tools visit http://www.cdc.gov/flu/weekly/fluviewinteractive.htm.
U.S. State and local influenza surveillance: Click on a jurisdiction below to access the latest local influenza information.

AlabamaExternal Web Site Icon
External Web Site Icon
AlaskaExternal Web Site Icon
External Web Site Icon
ArizonaExternal Web Site Icon
External Web Site Icon
ArkansasExternal Web Site Icon
External Web Site Icon
CaliforniaExternal Web Site Icon
External Web Site Icon
ColoradoExternal Web Site Icon
External Web Site Icon
ConnecticutExternal Web Site Icon
External Web Site Icon
DelawareExternal Web Site Icon
External Web Site Icon
District of ColumbiaExternal Web Site Icon
External Web Site Icon
FloridaExternal Web Site Icon
External Web Site Icon
GeorgiaExternal Web Site Icon
External Web Site Icon
HawaiiExternal Web Site Icon
External Web Site Icon
IdahoExternal Web Site Icon
External Web Site Icon
IllinoisExternal Web Site Icon
External Web Site Icon
IndianaExternal Web Site Icon
External Web Site Icon
IowaExternal Web Site Icon
External Web Site Icon
KansasExternal Web Site Icon
External Web Site Icon
KentuckyExternal Web Site Icon
External Web Site Icon
LouisianaExternal Web Site Icon
External Web Site Icon
MaineExternal Web Site Icon
External Web Site Icon
MarylandExternal Web Site Icon
External Web Site Icon
MassachusettsExternal Web Site Icon
External Web Site Icon
MichiganExternal Web Site Icon
External Web Site Icon
MinnesotaExternal Web Site Icon
External Web Site Icon
MississippiExternal Web Site Icon
External Web Site Icon
MissouriExternal Web Site Icon
External Web Site Icon
MontanaExternal Web Site Icon
External Web Site Icon
NebraskaExternal Web Site Icon
External Web Site Icon
NevadaExternal Web Site Icon
External Web Site Icon
New HampshireExternal Web Site Icon
External Web Site Icon
New JerseyExternal Web Site Icon
External Web Site Icon
New MexicoExternal Web Site Icon
External Web Site Icon
New YorkExternal Web Site Icon
External Web Site Icon
North CarolinaExternal Web Site Icon
External Web Site Icon
North DakotaExternal Web Site Icon
External Web Site Icon
OhioExternal Web Site Icon
External Web Site Icon
OklahomaExternal Web Site Icon
External Web Site Icon
OregonExternal Web Site Icon
External Web Site Icon
PennsylvaniaExternal Web Site Icon
External Web Site Icon
Rhode IslandExternal Web Site Icon
External Web Site Icon
South CarolinaExternal Web Site Icon
External Web Site Icon
South DakotaExternal Web Site Icon
External Web Site Icon
TennesseeExternal Web Site Icon
External Web Site Icon
TexasExternal Web Site Icon
External Web Site Icon
UtahExternal Web Site Icon
External Web Site Icon
VermontExternal Web Site Icon
External Web Site Icon
VirginiaExternal Web Site Icon
External Web Site Icon
Washington Adobe PDF fileExternal Web Site Icon
Adobe PDF fileExternal Web Site Icon
West VirginiaExternal Web Site Icon
External Web Site Icon
WisconsinExternal Web Site Icon
External Web Site Icon
WyomingExternal Web Site Icon
External Web Site Icon
New York CityExternal Web Site Icon
External Web Site Icon
Virgin IslandsExternal Web Site Icon
External Web Site Icon


Google Flu Trends: Google Flu Trends uses aggregated Google search data in a model created in collaboration with CDC to estimate influenza activity in the United States. For more information and activity estimates from the U.S. and worldwide, see http://www.google.org/flutrends/External Web Site Icon
World Health Organization: Additional influenza surveillance information from participating WHO member nations is available through FluNetExternal Web Site Icon and the Global Epidemiology Reports.External Web Site IconWHO Collaborating Centers for Influenza located in AustraliaExternal Web Site Icon, ChinaExternal Web Site Icon, JapanExternal Web Site Icon, and the United KingdomExternal Web Site Icon. Europe: for the most recent influenza surveillance information from Europe, please see WHO/Europe at http://www.euroflu.org/index.phpExternal Web Site Icon and visit the European Centre for Disease Prevention and Control at http://ecdc.europa.eu/en/publications/surveillance_reports/influenza/Pages/weekly_influenza_surveillance_overview.aspxExternal Web Site Icon
Public Health Agency of Canada: The most up-to-date influenza information from Canada is available at http://www.phac-aspc.gc.ca/fluwatch/External Web Site Icon
Health Protection Agency (United Kingdom): The most up-to-date influenza information from the United Kingdom is available at http://www.hpa.org.uk/Topics/InfectiousDiseases/InfectionsAZ/SeasonalInfluenza/External Web Site Icon


Any links provided to non-Federal organizations are provided solely as a service to our users. These links do not constitute an endorsement of these organizations or their programs by CDC or the Federal Government, and none should be inferred. CDC is not responsible for the content of the individual organization web pages found at these links.
--------------------------------------------------------------------------------
A description of surveillance methods is available at: http://www.cdc.gov/flu/weekly/overview.htm