2013年3月20日水曜日

日本のインフルエンザ(風邪)の各週の発生状況報告, 2003年ー2013年

日本のインフルエンザ(風邪)の各週の発生状況報告,  2003年ー2013年


Infectious Diseases Weekly Report (IDWR)

速報データ 2013年第10週(3月04日ー3月10日)

http://www.nih.go.jp/niid/ja/data/3334-idwr-sokuho-data-j-1310.html

定点把握疾患(週報告)、報告数、定点当り報告数、都道府県別

http://www.nih.go.jp/niid/images/idwr/sokuho/idwr-2013/201310/2013-10-teiten.pdf


報告数·定点当り報告数、疾病·都道府県別

2013年第10週(3月04日ー3月10日)
インフルエンザ

都道府県、定点当り,   週当りの報告数、

愛知県      27'27   5'317件
福井県      21'38     684件
鹿児島県  21'09   1'961件
徳島県      20'97      797件
広島県      20'66   2'376件
岐阜県    19'97    1'737件
高知県    19'77       949件
山口県    19'09    1'317件


次回の2013年第11週(3月11日ー3月17日)の更新は2013年3月26日です


定点把握疾患(週報告)、累積報告数、累積定点当り報告数、都道府県別

http://www.nih.go.jp/niid/images/idwr/sokuho/idwr-2013/201310/2013-10-teiten-ruiseki.pdf

累積報告数、累積定点当り報告数、疾病·都道府県別

2013年第10週(3月04日ー3月10日)

インフルエンザ

都道府県·累積定点当り報告数· 累積報告数

愛知県       297'76    57'765件
鹿児島県   240'05    22'325件
新潟県       237'76    22'587件
広島県       233'57    26'861件
 愛媛県      233´52   14'245件
長野県       222'85    19'388件
 福岡県      221'43    43'844件
千葉県       219'18    45'908件
宮崎県       214'51    12'656件
静岡県       209'55    29'128件
岐阜県       209'39   18'217件
埼玉県       207'12   49'916件
沖縄県       204'47   11'959件
茨城県       202'54   24'305件


疾病毎定点当り報告数(過去10年間との比較) 2003年ー2013年

http://www.nih.go.jp/niid/images/idwr/sokuho/idwr-2013/201310/binder10.pdf

疾病毎定点当り報告数(過去10年間との比較) 2003年ー2013年

インフルエンザ(風邪)の各週の発生率,  2003年ー2013年

2013年第4週1月20日ー1月26日と2013年第5週1月20日ー1月26日がインフルエンザ(風邪)の発生率が頂点·最高に達した。


注目すべき感染症

http://www.nih.go.jp/niid/ja/chumoku.html

Infectious Diseases Weekly Report 2012年第50週12月10日ー12月16日

2012年12月28日 発行

インフルエンザ(風邪)


http://www.nih.go.jp/niid/ja/flu-m/flu-idwrc/3055-idwrc-1250.html

※PDF版よりピックアップして掲載しています。

Infectious Diseases Weekly Report 2012年第49週12月03日ー12月09

2012年12月21日 発行

インフルエンザ(風邪)

http://www.nih.go.jp/niid/ja/flu-m/flu-idwrc/3023-idwrc-1249.html


感染症流行予測調査

National Epidemiological Surveillance of Vaccine Preventable Diseases

http://www.nih.go.jp/niid/ja/yosoku-index.html

2013年1月21日発表
インフルエンザ抗体保有状況
2012年度速報第3号

http://www.nih.go.jp/niid/ja/flu-m/253-idsc/yosoku/sokuhou/3118-flu-yosoku-rapid2012-3.html

インフルエンザ抗体保有状況 -2012年速報第3報- (2013年1月21日現在)
はじめに
 感染症流行予測調査事業における「インフルエンザ感受性調査」は,毎年,インフルエンザの本格的な流行が始まる前に,インフルエンザに対する国民の抗体保有状況(免疫状況)を把握し,抗体保有率が低い年齢層に対するワクチン接種の注意喚起ならびに今後のインフルエンザ対策における資料とすることを目的として実施している。
 現在使われているインフルエンザワクチンは,A(H1N1)亜型,A(H3N2)亜型,B型(ビクトリア系統あるいは山形系統)の3つのインフルエンザウイルスがワクチン株として用いられているが,インフルエンザ感受性調査では,これら3つのワクチン株に加え,ワクチンに用いられなかった別系統のB型インフルエンザウイルスについて抗体保有状況の検討を行っている。
 本速報では,2012年度の調査によるインフルエンザに対する年齢群別抗体保有状況および前年度調査との比較について掲載する。
1. 調査対象および方法
 2012年度の調査は,25都道府県から各198名,合計4,950名を対象として実施された。
 インフルエンザウイルスに対する抗体の有無および抗体価の測定は,対象者から採取された血液(血清)を用いて,調査を担当した都道府県衛生研究所において赤血球凝集抑制試験(HI法)により実施された。採血時期は原則として2012年7~9月(例年のインフルエンザの流行シーズン前かつワクチン接種前)とした。また,HI法に用いたインフルエンザウイルス(調査株)は以下の4つであり,このうちa)~c)は2012/13シーズンのインフルエンザワクチンに用いられているウイルス,d)はワクチン株とは異なる系統のB型インフルエンザウイルスであるが,抗体保有状況の把握が必要と考えられるウイルスである。
a) A/California(カリフォルニア)/7/2009 [A(H1N1)pdm09亜型]
b) A/Victoria(ビクトリア)/361/2011 [A(H3N2)亜型]
c) B/Wisconsin(ウィスコンシン)/1/2010 [B型(山形系統)]
d) B/Brisbane(ブリスベン)/60/2008 [B型(ビクトリア系統)]
2. 調査結果
 2013年1月21日現在,北海道,山形県,福島県,茨城県,栃木県,群馬県,千葉県,東京都,神奈川県,新潟県,富山県,石川県,福井県,山梨県,長野県,静岡県,愛知県,三重県,京都府,山口県,愛媛県,高知県,佐賀県,熊本県,宮崎県の25都道府県から合計6,794名の対象者についての結果が報告された。5歳ごとの年齢群別対象者数は,0-4歳群:857名,5-9歳群:538名,10-14歳群:605名,15-19歳群:540名,20-24歳群:534名,25-29歳群:592名,30-34歳群:521名,35-39歳群:531名,40-44歳群:492名,45-49歳群:385名,50-54歳群:372名,55-59歳群:316名,60-64歳群:284名,65-69歳群:116名,70歳以上群:111名であった。
 なお,本速報における抗体保有率とは,感染リスクを50%に抑える目安と考えられているHI抗体価1:40以上の抗体保有率を示し,抗体保有率が60%以上を「高い」,40%以上60%未満を「比較的高い」,25%以上40%未満を「中程度」,10%以上25%未満を「比較的低い」,5%以上10%未満を「低い」,5%未満を「きわめて低い」と表す。
1)年齢群別抗体保有状況
A/California(カリフォルニア)/7/2009 [A(H1N1)pdm09亜型]
:図1上段
 本ウイルスは2009年に世界的大流行(パンデミック)を起こしたインフルエンザウイルスである。2009/10シーズンは本ウイルスを用いた単価ワクチンが製造され,従来のインフルエンザワクチン(3価ワクチン)とは別に接種が行われたが,2010/11シーズン以降は3シーズン続けてワクチン株の1つとして選定されている。
 本ウイルスに対する抗体保有率は,0-4歳群および55歳以上の各年齢群で中程度以下の抗体保有率(22~36%)であったが,それ以外の年齢群は比較的高い~高い抗体保有率(43~80%)であった。中でも10~24歳の各年齢群は60%以上の抗体保有率であり,15-19歳群で最も高かった。全体の抗体保有率は51%であり,調査株中最も高かった。

A/Victoria(ビクトリア)/361/2011 [A(H3N2)亜型]:図1下段
 本ウイルスは2012/13シーズンのワクチン株の1つとして選定されたウイルスであり,2010/11~2011/12シーズンにワクチン株であったA/Victoria(ビクトリア)/210/2009から変更となった。
 本ウイルスに対する全体の抗体保有率は調査株中2番目に低い40%であった。年齢群別では5~44歳の各年齢群および70歳以上群は比較的高い抗体保有率(40~54%)であったが,それ以外の年齢群は中程度以下の抗体保有率(22~34%)であり,特に0-4歳群は25%未満の抗体保有率であった。

B/Wisconsin(ウィスコンシン)/1/2010 [B型(山形系統)]:図2上段
 本ウイルスは2010年に分離されたB型インフルエンザウイルスであり,2012/13シーズンは4シーズンぶりに山形系統の本ウイルスがワクチン株の1つに選定された。
 本ウイルスに対する抗体保有率は,全体では31%と調査株中最も低く,年齢群別では20-24歳群をピークに15~29歳の各年齢群のみが40%以上の抗体保有率(48~65%)であった。それ以外の年齢群は中程度以下の抗体保有率(9~37%)を示し,中でも10歳未満および50歳以上の各年齢群は25%未満の抗体保有率であった。

B/Brisbane(ブリスベン)/60/2008 [B型(ビクトリア系統)]:図2下段
 本ウイルスは2009/10~2011/12シーズンまで3シーズン連続してワクチン株に選ばれたウイルスであり,本年度調査におけるビクトリア系統の代表として用いた。
 本ウイルスに対する抗体保有率は,0-4歳群および60歳以上の各年齢群で中程度以下の抗体保有率(20~32%)であったが,それ以外の年齢群は比較的高い~高い抗体保有率(41~69%)であった。中でも35~44歳の各年齢群は60%以上の抗体保有率であり,35-39歳群で最も高かった。全体の抗体保有率は調査株中2番目に高い47%であった。
図1


図2
2)年齢群別抗体保有状況の前年度調査との比較
A(H1N1)pdm09亜型
:図3上段
 A(H1N1)pdm09亜型については,2009/10~2012/13シーズンのワクチン株(2009/10シーズンは単価ワクチンとして)および2009~2012年度の調査株にA/California(カリフォルニア)/7/2009が連続して用いられた。2009年度は多くの年齢群で10%未満の抗体保有率であり,全体でも8%と低かったが,2010年度にはすべての年齢群で上昇し,全体では40%の抗体保有率であった(グラフなし)。2011年度もすべての年齢群で抗体保有率の上昇がみられ,全体では49%であった。これらの上昇には2009/10および2010/11シーズンにおける流行1),2)が大きく影響していると考えられた。2012年度は多くの年齢群で前年度よりもさらに上昇し,全体の抗体保有率は51%であったが,2011/12シーズンはA(H1N1)pdm09亜型の流行がほとんどみられなかった3)ことを踏まえると,同じワクチン株が連続して用いられたことによる(ワクチン接種者あるいは感染者における)ブースター効果により,調査時まで抗体保有が持続していた影響も考えられた。

A(H3N2)亜型:図3下段
 A(H3N2)亜型については,A/Victoria(ビクトリア)/210/2009が2010/11~2011/12シーズンのワクチン株および2010~2011年度調査株に連続して用いられたが,2012/13シーズンのワクチン株および2012年度の調査株はA/Victoria(ビクトリア)/361/2011に変更となった。2010年度は全体で40%の抗体保有率であったが(グラフなし),2011年度には50%に上昇しており,2010/11シーズンにみられたA(H3N2)亜型の流行2)が一因と考えられた。2012年度は調査株の変更により,すべての年齢群で抗体保有率は低下し,全体では40%の抗体保有率であった。

B型(山形系統)]:図4上段
 山形系統については,4シーズンぶりにワクチン株の1つに選定され,2012年度の調査株は2012/13シーズンのワクチン株であるB/Wisconsin(ウィスコンシン)/1/2010が用いられた。2011年度にも本ウイルスが調査株として用いられ,抗体保有率はすべての年齢群で40%未満であり,全体では18%程度であった。2012年度はほとんどの年齢群で上昇し,全体では31%の抗体保有率となった。これは2011/12シーズンの中盤以降にみられた山形系統の流行3)が影響の一因として考えられた。

B型(ビクトリア系統):図4下段
 ビクトリア系統については,2009/10~2011/12シーズンのワクチン株および2009~2012年度の調査株としてB/Brisbane(ブリスベン)/60/2008が連続して用いられた。全体の抗体保有率は2009年度と2010年度がそれぞれ31%と33%であり(グラフなし),2011年度は45%,2012年度は47%と徐々に上昇していた。これらは2010/11~2011/12シーズンにみられたビクトリア系統の流行2),3)や2011/12シーズンまで3シーズン連続して同じワクチン株が用いられた影響と考えられた。しかし,抗体保有率のピークを示す年齢層がA型や山形系統と異なる傾向については不明である。
図3


図4
コメント
 今シーズンは2013年1月10日現在,病原微生物検出情報におけるインフルエンザウイルス分離・検出速報によると,2012年第36週~2013年第2週(9月3日~1月10日)の期間にA(H1)pdm09亜型が25件,A(H3)亜型が411件,B型が41件(山形系統:12件,ビクトリア系統:21件,系統不明:8件)の報告があり,現時点では主にA(H3)亜型が分離・検出されている4)。また,感染症発生動向調査によるインフルエンザ患者の定点あたり報告数は2012年第50週(12月10日~16日)に全国的な流行開始の指標となる1.0を上回り,2013年第2週(1月7日~13日)現在12.07と急増している5)。まだ予防接種を受けていない者,特に本調査において抗体保有率が低かった年齢層においては,ワクチン接種等の早めの予防対策が望まれる。
1)インフルエンザ 2009/10シーズン
  病原微生物検出情報 月報,Vol.31,No.9:p248-250
2)インフルエンザ 2010/11シーズン
  病原微生物検出情報 月報,Vol.32,No.11:p314-316
3)インフルエンザ 2011/12シーズン
  病原微生物検出情報 月報,Vol.33,No.11:p285-287
4)インフルエンザウイルス分離・検出速報 2012/13シーズン
  URL:http://www.nih.go.jp/niid/ja/iasr-inf.html
5)インフルエンザ患者発生状況
  URL:http://www.nih.go.jp/niid/images/idsc/disease/influenza/pdm2013-scv/02influenza.csv

国立感染症研究所 感染症情報センター/インフルエンザウイルス研究センター


2012年12月27日発表
インフルエンザ抗体保有状況
2012年度速報第2号

http://www.nih.go.jp/niid/ja/flu-m/253-idsc/yosoku/sokuhou/3029-flu-yosoku-rapid2012-2.html

インフルエンザ抗体保有状況 -2012年速報第2報- (2012年12月27日現在)
はじめに
 感染症流行予測調査事業における「インフルエンザ感受性調査」は,毎年,インフルエンザの本格的な流行が始まる前に,インフルエンザに対する国民の抗体保有状況(免疫状況)を把握し,抗体保有率が低い年齢層に対するワクチン接種の注意喚起ならびに今後のインフルエンザ対策における資料とすることを目的として実施している。
 現在使われているインフルエンザワクチンは,A(H1N1)亜型,A(H3N2)亜型,B型(ビクトリア系統あるいは山形系統)の3つのインフルエンザウイルスがワクチン株として用いられているが,インフルエンザ感受性調査では,これら3つのワクチン株に加え,ワクチンに用いられなかった別系統のB型インフルエンザウイルスについて抗体保有状況の検討を行っている。
 本速報では,2012年度の調査によるインフルエンザに対する年齢群別抗体保有状況および前年度調査との比較について掲載する。
1. 調査対象および方法
 2012年度の調査は,25都道府県から各198名,合計4,950名を対象として実施された。
 インフルエンザウイルスに対する抗体の有無および抗体価の測定は,対象者から採取された血液(血清)を用いて,調査を担当した都道府県衛生研究所において赤血球凝集抑制試験(HI法)により実施された。採血時期は原則として2012年7~9月(例年のインフルエンザの流行シーズン前かつワクチン接種前)とした。また,HI法に用いたインフルエンザウイルス(調査株)は以下の4つであり,このうちa)~c)は2012/13シーズンのインフルエンザワクチンに用いられているウイルス,d)はワクチン株とは異なる系統のB型インフルエンザウイルスであるが,抗体保有状況の把握が必要と考えられるウイルスである。
a) A/California(カリフォルニア)/7/2009 [A(H1N1)pdm09亜型]
b) A/Victoria(ビクトリア)/361/2011 [A(H3N2)亜型]
c) B/Wisconsin(ウィスコンシン)/1/2010 [B型(山形系統)]
d) B/Brisbane(ブリスベン)/60/2008 [B型(ビクトリア系統)]
2. 調査結果
 2012年12月27日現在,北海道,山形県,福島県,茨城県,栃木県,群馬県,千葉県,東京都,神奈川県,新潟県,富山県,石川県,福井県,山梨県,長野県,静岡県,三重県,京都府,山口県,愛媛県,高知県,佐賀県,熊本県,宮崎県の24都道府県から合計6,552名の対象者についての結果が報告された。5歳ごとの年齢群別対象者数は,0-4歳群:828名,5-9歳群:511名,10-14歳群:583名,15-19歳群:514名,20-24歳群:521名,25-29歳群:578名,30-34歳群:507名,35-39歳群:518名,40-44歳群:477名,45-49歳群:370名,50-54歳群:357名,55-59歳群:294名,60-64歳群:272名,65-69歳群:114名,70歳以上群:108名であった。
 なお,本速報における抗体保有率とは,感染リスクを50%に抑える目安と考えられているHI抗体価1:40以上の抗体保有率を示し,抗体保有率が60%以上を「高い」,40%以上60%未満を「比較的高い」,25%以上40%未満を「中程度」,10%以上25%未満を「比較的低い」,5%以上10%未満を「低い」,5%未満を「きわめて低い」と表す。
1)年齢群別抗体保有状況
A/California(カリフォルニア)/7/2009 [A(H1N1)pdm09亜型]
:図1上段
 本ウイルスは2009年に世界的大流行(パンデミック)を起こしたインフルエンザウイルスである。2009/10シーズンは本ウイルスを用いた単価ワクチンが製造され,従来のインフルエンザワクチン(3価ワクチン)とは別に接種が行われたが,2010/11シーズン以降は3シーズン続けてワクチン株の1つとして選定されている。
 本ウイルスに対する抗体保有率は,0-4歳群および55歳以上の各年齢群で中程度以下の抗体保有率(23~36%)であったが,それ以外の年齢群は比較的高い~高い抗体保有率(43~80%)であった。中でも10~24歳の各年齢群は60%以上の抗体保有率であり,15-19歳群で最も高かった。全体の抗体保有率は51%であり,調査株中最も高かった。

A/Victoria(ビクトリア)/361/2011 [A(H3N2)亜型]:図1下段
 本ウイルスは2012/13シーズンのワクチン株の1つとして選定されたウイルスであり,2010/11~2011/12シーズンにワクチン株であったA/Victoria(ビクトリア)/210/2009から変更となった。
 本ウイルスに対する全体の抗体保有率は調査株中2番目に低い40%であった。年齢群別では5~44歳の各年齢群および70歳以上群は比較的高い抗体保有率(40~54%)であったが,それ以外の年齢群は中程度以下の抗体保有率(22~34%)であり,特に0-4歳群は25%未満の抗体保有率であった。

B/Wisconsin(ウィスコンシン)/1/2010 [B型(山形系統)]:図2上段
 本ウイルスは2010年に分離されたB型インフルエンザウイルスであり,2012/13シーズンは4シーズンぶりに山形系統の本ウイルスがワクチン株の1つに選定された。
 本ウイルスに対する抗体保有率は,全体では31%と調査株中最も低く,年齢群別では20-24歳群をピークに15~29歳の各年齢群のみが40%以上の抗体保有率(48~65%)であった。それ以外の年齢群は中程度以下の抗体保有率(10~37%)を示し,中でも10歳未満および50歳以上の各年齢群は25%未満の抗体保有率であった。

B/Brisbane(ブリスベン)/60/2008 [B型(ビクトリア系統)]:図2下段
 本ウイルスは2009/10~2011/12シーズンまで3シーズン連続してワクチン株に選ばれたウイルスであり,本年度調査におけるビクトリア系統の代表として用いた。
 本ウイルスに対する抗体保有率は,0-4歳群および60歳以上の各年齢群で中程度以下の抗体保有率(20~33%)であったが,それ以外の年齢群は比較的高い~高い抗体保有率(41~69%)であった。中でも30~44歳の各年齢群は60%以上の抗体保有率であり,35-39歳群で最も高かった。全体の抗体保有率は調査株中2番目に高い47%であった。
図1


図2
2)年齢群別抗体保有状況の前年度調査との比較
A(H1N1)pdm09亜型
:図3上段
 A(H1N1)pdm09亜型については,2009/10~2012/13シーズンのワクチン株(2009/10シーズンは単価ワクチンとして)および2009~2012年度の調査株にA/California(カリフォルニア)/7/2009が連続して用いられた。2009年度は多くの年齢群で10%未満の抗体保有率であり,全体でも8%と低かったが,2010年度にはすべての年齢群で上昇し,全体では40%の抗体保有率であった(グラフなし)。2011年度もすべての年齢群で抗体保有率の上昇がみられ,全体では49%であった。これらの上昇には2009/10および2010/11シーズンにおける流行1),2)が大きく影響していると考えられた。2012年度は多くの年齢群で前年度よりもさらに上昇し,全体の抗体保有率は51%であったが,2011/12シーズンはA(H1N1)pdm09亜型の流行がほとんどみられなかった3)ことを踏まえると,同じワクチン株が連続して用いられたことによる(ワクチン接種者あるいは感染者における)ブースター効果により,調査時まで抗体保有が持続していた影響も考えられた。

A(H3N2)亜型:図3下段
 A(H3N2)亜型については,A/Victoria(ビクトリア)/210/2009が2010/11~2011/12シーズンのワクチン株および2010~2011年度調査株に連続して用いられたが,2012/13シーズンのワクチン株および2012年度の調査株はA/Victoria(ビクトリア)/361/2011に変更となった。2010年度は全体で40%の抗体保有率であったが(グラフなし),2011年度には50%に上昇しており,2010/11シーズンにみられたA(H3N2)亜型の流行2)が一因と考えられた。2012年度は調査株の変更により,すべての年齢群で抗体保有率は低下し,全体では40%の抗体保有率であった。

B型(山形系統)]:図4上段
 山形系統については,4シーズンぶりにワクチン株の1つに選定され,2012年度の調査株は2012/13シーズンのワクチン株であるB/Wisconsin(ウィスコンシン)/1/2010が用いられた。2011年度にも本ウイルスが調査株として用いられ,抗体保有率はすべての年齢群で40%未満であり,全体では18%程度であった。2012年度はほとんどの年齢群で上昇し,全体では31%の抗体保有率となった。これは2011/12シーズンの中盤以降にみられた山形系統の流行3)が影響の一因として考えられた。

B型(ビクトリア系統):図4下段
 ビクトリア系統については,2009/10~2011/12シーズンのワクチン株および2009~2012年度の調査株としてB/Brisbane(ブリスベン)/60/2008が連続して用いられた。全体の抗体保有率は2009年度と2010年度がそれぞれ31%と33%であり(グラフなし),2011年度は45%,2012年度は47%と徐々に上昇していた。これらは2010/11~2011/12シーズンにみられたビクトリア系統の流行2),3)や2011/12シーズンまで3シーズン連続して同じワクチン株が用いられた影響と考えられた。しかし,抗体保有率のピークを示す年齢層がA型や山形系統と異なる傾向については不明である。
図3


図4
コメント
 今シーズンは2012年12月27日現在,病原微生物検出情報におけるインフルエンザウイルス分離・検出速報によると,2012年第36~51週(9月3日~12月20日)の期間にA(H1)pdm09亜型が15件,A(H3)亜型が177件,B型が26件(山形系統:11件,ビクトリア系統:11件,系統不明:4件)の報告があり,現時点では主にA(H3)亜型が分離・検出されている4)。また,感染症発生動向調査によるインフルエンザ患者の定点あたり報告数は2012年第50週(12月10日~16日)に1.17となり,全国的な流行開始の指標となる1.0を上回った5)。まだ予防接種を受けていない者,特に本調査において抗体保有率が低かった年齢層においては,ワクチン接種等の早めの予防対策が望まれる。
1)インフルエンザ 2009/10シーズン
  病原微生物検出情報 月報,Vol.31,No.9:p248-250
2)インフルエンザ 2010/11シーズン
  病原微生物検出情報 月報,Vol.32,No.11:p314-316
3)インフルエンザ 2011/12シーズン
  病原微生物検出情報 月報,Vol.33,No.11:p285-287
4)インフルエンザウイルス分離・検出速報 2012/13シーズン
  URL:http://www.nih.go.jp/niid/ja/iasr-inf.html
5)IDWR速報データ2012年第50週
  URL:http://www.nih.go.jp/niid/ja/data/3035-idwr-sokuho-data-j-1250.html

国立感染症研究所 感染症情報センター/インフルエンザウイルス研究センター


2012年12月07日発表
インフルエンザ抗体保有状況
2012年度速報第1号

http://www.nih.go.jp/niid/ja/flu-m/253-idsc/yosoku/sokuhou/2986-flu-yosoku-rapid2012-1.html

インフルエンザ抗体保有状況 -2012年速報第1報- (2012年12月7日現在)
はじめに
 感染症流行予測調査事業における「インフルエンザ感受性調査」は,毎年,インフルエンザの本格的な流行が始まる前に,インフルエンザに対する国民の抗体保有状況(免疫状況)を把握し,抗体保有率が低い年齢層に対するワクチン接種の注意喚起ならびに今後のインフルエンザ対策における資料とすることを目的として実施している。
 現在使われているインフルエンザワクチンは,A(H1N1)亜型,A(H3N2)亜型,B型(ビクトリア系統あるいは山形系統)の3つのインフルエンザウイルスがワクチン株として用いられているが,インフルエンザ感受性調査では,これら3つのワクチン株に加え,ワクチンに用いられなかった別系統のB型インフルエンザウイルスについて抗体保有状況の検討を行っている。
 本速報では,2012年度の調査によるインフルエンザに対する年齢群別抗体保有状況および前年度調査との比較(第2報以降)について掲載する。
1. 調査対象および方法
 2012年度の調査は,25都道府県から各198名,合計4,950名を対象として実施された。
 インフルエンザウイルスに対する抗体の有無および抗体価の測定は,対象者から採取された血液(血清)を用いて,調査を担当した都道府県衛生研究所において赤血球凝集抑制試験(HI法)により実施された。採血時期は原則として2012年7~9月(例年のインフルエンザの流行シーズン前かつワクチン接種前)とした。また,HI法に用いたインフルエンザウイルス(調査株)は以下の4つであり,このうちa)~c)は2012/13シーズンのインフルエンザワクチンに用いられているウイルス,d)はワクチン株とは異なる系統のB型インフルエンザウイルスであるが,抗体保有状況の把握が必要と考えられるウイルスである。
a) A/California(カリフォルニア)/7/2009 [A(H1N1)pdm09亜型]
b) A/Victoria(ビクトリア)/361/2011 [A(H3N2)亜型]
c) B/Wisconsin(ウィスコンシン)/1/2010 [B型(山形系統)]
d) B/Brisbane(ブリスベン)/60/2008 [B型(ビクトリア系統)]
2. 調査結果
 2012年12月7日現在,北海道,山形県,福島県,栃木県,千葉県,東京都,神奈川県,新潟県,富山県,石川県,福井県,山梨県,長野県,三重県,山口県,愛媛県,高知県,宮崎県の18都道府県から合計4,955名の対象者についての結果が報告された。5歳ごとの年齢群別対象者数は,0-4歳群:619名,5-9歳群:393名,10-14歳群:409名,15-19歳群:369名,20-24歳群:412名,25-29歳群:445名,30-34歳群:409名,35-39歳群:405名,40-44歳群:371名,45-49歳群:304名,50-54歳群:265名,55-59歳群:212名,60-64歳群:175名,65-69歳群:80名,70歳以上群:87名であった。
 なお,本速報における抗体保有率とは,感染リスクを50%に抑える目安と考えられているHI抗体価1:40以上の抗体保有率を示し,抗体保有率が60%以上を「高い」,40%以上60%未満を「比較的高い」,25%以上40%未満を「中程度」,10%以上25%未満を「比較的低い」,5%以上10%未満を「低い」,5%未満を「きわめて低い」と表す。
1)年齢群別抗体保有状況
A/California(カリフォルニア)/7/2009 [A(H1N1)pdm09亜型]
:図1上段
 本ウイルスは2009年に世界的大流行(パンデミック)を起こしたインフルエンザウイルスである。2009/10シーズンは本ウイルスを用いた単価ワクチンが製造され,従来のインフルエンザワクチン(3価ワクチン)とは別に接種が行われたが,2010/11シーズン以降は3シーズン続けてワクチン株の1つとして選定されている。
 本ウイルスに対する抗体保有率は,0-4歳群および55歳以上の各年齢群で中程度の抗体保有率(26~36%)であったが,それ以外の年齢群は比較的高い~高い抗体保有率(45~81%)であった。中でも5~24歳の各年齢群は60%以上の抗体保有率(61~81%)であり,15-19歳群で最も高かった。全体の抗体保有率は53.1%であり,調査株中最も高かった。

A/Victoria(ビクトリア)/361/2011 [A(H3N2)亜型]:図1下段
 本ウイルスは2012/13シーズンのワクチン株の1つとして選定されたウイルスであり,2010/11~2011/12シーズンにワクチン株であったA/Victoria(ビクトリア)/210/2009から変更となった。
 本ウイルスに対する全体の抗体保有率は調査株中2番目に低い42.8%であった。年齢群別では5~44歳の各年齢群および70歳以上群は比較的高い抗体保有率(41~57%)であったが,それ以外の年齢群は中程度以下の抗体保有率(23~36%)であり,特に0-4歳群と65-69歳群は25%未満の抗体保有率(23%)であった。

B/Wisconsin(ウィスコンシン)/1/2010 [B型(山形系統)]:図2上段
 本ウイルスは2010年に分離されたB型インフルエンザウイルスであり,2012/13シーズンは4シーズンぶりに山形系統の本ウイルスがワクチン株の1つに選定された。
 本ウイルスに対する抗体保有率は,全体では35.0%と調査株中最も低く,年齢群別では20-24歳群をピークに15~34歳の各年齢群のみが40%以上の抗体保有率(42~70%)であった。それ以外の年齢群は中程度以下の抗体保有率(9~39%)を示し,中でも10歳未満および55歳以上の各年齢群は25%未満の抗体保有率(9~24%)であり,65-69歳群で最も低かった。

B/Brisbane(ブリスベン)/60/2008 [B型(ビクトリア系統)]:図2下段
 本ウイルスは2009/10~2011/12シーズンまで3シーズン連続してワクチン株に選ばれたウイルスであり,本年度調査におけるビクトリア系統の代表として用いた。
 本ウイルスに対する抗体保有率は,0-4歳群および60歳以上の各年齢群で中程度以下の抗体保有率(22~32%)であった。それ以外の年齢群で5~24歳および45~59歳の各年齢群は比較的高い抗体保有率(41~59%)であり,25~44歳の各年齢群は35-39歳群をピークに60%以上の抗体保有率(62~78%)であった。全体の抗体保有率は調査株中2番目に高い52.5%であった。
図1


図2
2)年齢群別抗体保有状況の前年度調査との比較
※第2報以降に掲載予定
コメント
 今シーズンは2012年12月7日現在,病原微生物検出情報におけるインフルエンザウイルス分離・検出速報によると,2012年第36~47週(9月3日~11月25日)の期間にA(H1)pdm09亜型が12件,A(H3)亜型が96件,B型が8件(ビクトリア系統:4件,山形系統:1件,系統不明:3件)の報告があり,現時点では主にA(H3)亜型が分離・検出されている1)。また,感染症発生動向調査によるインフルエンザ患者の定点あたり報告数は2012年第47週(11月19日~25日)の速報値で0.22であり2),全国的な流行の指標となる1.0に達していないが,本調査において抗体保有率が低かった年齢層においては,本格的な流行シーズンが始まる前にワクチン接種等の予防対策を行うことが望まれる。
1)病原微生物検出情報‐インフルエンザウイルス分離・検出速報 2012/13シーズン
  国立感染症研究所HP [http://www.nih.go.jp/niid/ja/iasr-inf.html
2)感染症発生動向調査‐速報データ2012年第47週
  国立感染症研究所HP [http://www.nih.go.jp/niid/ja/data/2958-idwr-sokuho-data-j-1247.html

国立感染症研究所 感染症情報センター/インフルエンザウイルス研究センター

日本の2013年までの各週のインフルエンザ(風邪)ビールスの、インフルエンザb、インフルエンザA(H3)、インフルエンザA(H1)、インフルエンザA(H1)pdm09の 発生数、発生割合

https://nesid3g.mhlw.go.jp/Byogentai/Pdf/data2j.pdf


日本の2012年/2013年のインフルエンザ(風邪)感染死亡者の統計報告


2013年03月20日水曜日曇り/小雨 最低気温;7ー9ºc、最高気温;111ー13ºc、

日本の2012年/2013年のインフルエンザ(風邪)感染死亡者の統計報告


国立感染研究所

http://www.nih.go.jp/niid/ja/from-idsc.html

感染症情報センター

インフルエンザ関連死亡迅速把握システム

2013年03月15日発表

http://www.nih.go.jp/niid/ja/flu-m/2112-idsc/jinsoku/131-flu-jinsoku.html

過去の全国の超過死亡の推移(感染研モデル) 2012/13 シーズングラフ
http://www.nih.go.jp/niid/ja/flu-m/2112-idsc/jinsoku/1847-flu-jinsoku-2.html


20大都市の合計 


日本の2012年第49週12月02日から2013年第9週2月24日から3月2日までのインフルエンザ(風邪)感染死亡者は約5'110人。
2012年第35週8月26日から9月1日から第48週11月25日ー12月1日までのインフルエンザ感染死亡者を各週400人と仮定すると400×19=7600だから7600+5110=12´170。
2012年第35週8月26日から9月1日から第48週11月25日ー12月1日までのインフルエンザ感染死亡者を各週350人と仮定すると350×19=6650だから6650+5110=11´760。
日本の2012年第35週8月26日から2013年第9週3月2日までのインフルエンザ(風邪)感染死亡者は1万1800人-1万2000人くらいにはなるだろ??!!!!


日本の2013年\第9週2月24日ー3月2日のインフルエンザ(風邪)感染死者は120/120人

日本の2013年\第8週2月17日ー2月23日のインフルエンザ(風邪)感染死者は270/265人

日本の2013年\第7週2月10日ー2月16日のインフルエンザ(風邪)感染死者は450/440人

日本の2013年\第6週2月03日ー02月09日のインフルエンザ(風邪)感染死者は395/395人

日本の2013年\第5週1月27日ー2月02日のインフルエンザ(風邪)感染死者は310/310人

日本の2013年\第4週1月20日ー1月26日のインフルエンザ(風邪)感染死者は480/480人

日本の2013年\第3週1月13日ー1月19日のインフルエンザ(風邪)感染死者は470/460人

日本の2013年\第2週1月06日ー1月12日のインフルエンザ(風邪)感染死者は430/430人

2013年第1週2012年12月30日ー2013年1月5日インフルエンザ(風邪)感染死者は400/400人

日本の2012年\第52週12月23日ー12月29日のインフルエンザ(風邪)感染死者は430/425人

日本の2012年\第51週12月16日ー12月22日のインフルエンザ(風邪)感染死者は460/465人

日本の2012年\第50週12月09日ー12月15日のインフルエンザ(風邪)感染死者は480/480人

日本の2012年\第49週12月02日ー12月08日のインフルエンザ(風邪)感染死者は415/415人

2013年3月19日火曜日

癌と老化に関連する変異細胞が発見される

EL PAIS

癌と老化に関連する変異細胞が発見される

Identificada una mutación de un gen que relaciona cáncer y envejecimiento

La protección de los extremos de los cromosomas es el vínculo entre ambos procesos


El País Madrid 18 MAR 2013 - 15:42 CET

Cáncer y envejecimiento son, estadísticamente, una pareja estrechamente relacionada. Y un estudio que ha publicado Nature genetics da una posible clave molecular de este vínculo. El trabajo pone de manifiesto la existencia de una mutación en un gen, el llamado POT1, que está a la vez relacionado con la leucemia linfática crónica –lo que indica su participación al menos en este tipo de cáncer- y con la preservación de los telómeros, los extremos de los cromosomas (los libros donde están empaquetados los genes), cuya longitud está ligada al envejecimiento.


más información
El descubrimiento del genoma de un tipo de leucemia permitirá establecer terapias individuales
El epigenoma de la leucemia permitirá predecir la evolución de la enfermedad
La longitud de los telómeros determina la salud

Para llegar a estas conclusiones han coincidido varios grupos de trabajo, como el del Centro Nacional de Investigaciones Oncológicas (CNIO) que dirige María Blasco, experta en telómeros, y el gripo español encargado de secuenciar el genoma del linfoma, que dirigen Carlos López-Otín en la Universidad de Oviedo y Elías Campo, del hospital Clínic de Barcelona.

Es la primera vez que aparece mutado en un cáncer humano un gen relacionado con la conservación de los telómeros, indica el CNIO en una nota. “Llevamos mucho tiempo estudiando la biología de los telómeros, ya que alteraciones en su mantenimiento se asocian al cáncer y al envejecimiento”, declara Blasco en esa nota. “Aunque se conocen los mecanismos por los que las células tumorales alteran sus telómeros, las mutaciones en POT1 revelan otra ruta hasta ahora desconocida”, añade.

Conocer los genes implicados en un proceso es solo la primera parte de cualquier trabajo. Pone la primera piedra para posibles futuros desarrollos que pueden ir desde el análisis precoz (el POT1 se asocia a las formas más agresivas de leucemia) a una posible intervención farmacológica si se identifican los procesos afectados y qué proteínas se activan o dejan de funcionar en función de las mutaciones. En cualquier caso, es un trabajo a largo plazo.

========================================================


Identification of a mutation of a gene that cancer and aging related


The protection of chromosome ends is the link between the two processes


The Country Madrid 18 MAR 2013 - 15:42 CET


Cancer and aging are, statistically, a couple closely related. And a study published in Nature Genetics provides a possible molecular key to this link. The work demonstrates the existence of a mutation in a gene called POT1, which is both related to chronic lymphocytic leukemia, indicating their participation at least in this type of cancer, and the preservation of telomeres The ends of chromosomes (books which are packaged genes), whose length is related to aging.


moreThe discovery of the genome of a type of leukemia therapies will establish individualThe epigenome of leukemia will predict the evolution of the diseaseThe telomere length determines health
To reach these conclusions have agreed number of working groups, such as the National Cancer Research Centre (CNIO) directed María Blasco, an expert on telomeres, and the Spanish Gripo responsible for sequencing the genome of lymphoma, which direct Carlos Lopez-Otin at the University of Oviedo and Elias Campo, Hospital Clínic de Barcelona.
It is the first time it appears mutated in human cancer related gene conservation of telomeres, indicating the CNIO in a note. "We have long been studying the biology of telomeres, as alterations in its maintenance are associated with cancer and aging," says Blasco on that note. "Although we know the mechanisms by which tumor cells alter their telomeres, mutations in POT1 reveal another hitherto unknown route," he adds.
Knowing the genes involved in a process is only the first part of any job. Laying the foundation for possible future developments that can range from early analysis (the POT1 is associated with more aggressive forms of leukemia) a possible pharmacological intervention if identified processes involved and which proteins are activated or stop working according mutations. In any case it is a long-term.

その遺伝子の変異の同定と関連老化


染色体末端を保護することは、二つのプロセス間のリンクです


カントリーマドリード18 MAR 2013 - 午後03時42分CET
 
がんや老化は、統計的に、密接に関連してカップルです。とネイチャージェネティクスに発表された研究は、このリンクへの可能な分子キーを提供します。仕事は、少なくともこのタイプの癌、とテロメアの維持への参加を示す、慢性リンパ球性白血病に関連している両方のPOT1と呼ばれる遺伝子の変異の存在を示していますその長さは老化に関係している染色体の末端(パッケージ化された遺伝子である書籍)。


もっと白血病の治療法の種類のゲノムの発見は、個々の確立します白血病のエピゲノムは、疾患の進行を予測するテロメアの長さは、健康を決定
到達するためにこれらの結論は、このような直接的カルロスロペスOtinマリア·ブラスコ、テロメアの専門家、およびリンパ腫のゲノムを配列決定するための責任があるスペイン語Gripoを、監督国立がん研究センター(CNIO)などのワーキンググループの数を合意しているオビエドとエリアスカンポ、病院·クリニック·デ·バルセロナ大学。
それはノートのCNIOを示す、テロメアのヒト癌関連遺伝子の保全において変異し、それが最初に表示される時間です。 "我々は長いテロメアの生物学を研究してきた、その維持の変化は、がんや老化に関連付けられているように、"そのノートにブラスコ氏は述べています。 "我々は、腫瘍細胞がそれらのテロメアを変更するためのメカニズムを知っているが、POT1の変異は別の未知の経路を明らかにする"と彼は付け加えた。
プロセスに関与する遺伝子を知ることが唯一の任意のジョブの最初の部分です。識別されたプロセスが関与した場合の早期分析の範囲とすることができる可能性の将来の発展のための基盤(POT1は、白血病のより積極的なフォームに関連付けられている)可能な薬理学的介入を敷設し、タンパク質を活性化またはに従って作業を停止している突然変異。いずれにせよ、長期的です。

2013年3月17日日曜日

日本の2012年/2013年のインフルエンザ(風邪)感染死亡者の統計報告/日本の2013年\第9週2月24日ー3月2日のインフルエンザ(風邪)感染死者は120人

日本の2012年/2013年のインフルエンザ(風邪)感染死亡者の統計報告


国立感染研究所

http://www.nih.go.jp/niid/ja/from-idsc.html

感染症情報センター

インフルエンザ関連死亡迅速把握システム

2013年03月15日発表

http://www.nih.go.jp/niid/ja/flu-m/2112-idsc/jinsoku/131-flu-jinsoku.html

日本の2012年第49週12月02日から2013年第9週2月24日から3月2日までのインフルエンザ(風邪)感染死亡者は約5'110人。
     2012年第35週8月26日から9月1日から第48週11月25日ー12月1日までのインフルエンザ感染死亡者を各週400人と仮定すると400×19=7600だから7600+5110=12´170。
      2012年第35週8月26日から9月1日から第48週11月25日ー12月1日までのインフルエンザ感染死亡者を各週350人と仮定すると350×19=6650だから6650+5110=11´760。
      日本の2012年第35週8月26日から2013年第9週3月2日までのインフルエンザ(風邪)感染死亡者は1万1800人-1万2000人くらいにはなるだろ??!!!!


日本の2013年\第9週2月24日ー3月2日のインフルエンザ(風邪)感染死者は120人

日本の2013年\第8週2月17日ー2月23日のインフルエンザ(風邪)感染死者は270人

日本の2013年\第7週2月10日ー2月16日のインフルエンザ(風邪)感染死者は450人

日本の2013年\第6週2月03日ー02月09日のインフルエンザ(風邪)感染死者は395人

日本の2013年\第5週1月27日ー2月02日のインフルエンザ(風邪)感染死者は310人

日本の2013年\第4週1月20日ー1月26日のインフルエンザ(風邪)感染死者は480人

日本の2013年\第3週1月13日ー1月19日のインフルエンザ(風邪)感染死者は470人

日本の2013年\第2週1月06日ー1月12日のインフルエンザ(風邪)感染死者は430人

日本の2013年\第1週2012年12月30日ー2013年1月5日のインフルエンザ(風邪)感染死者は400人

日本の2012年\第52週12月23日ー12月29日のインフルエンザ(風邪)感染死者は430人

日本の2012年\第51週12月16日ー12月22日のインフルエンザ(風邪)感染死者は460人

日本の2012年\第50週12月09日ー12月15日のインフルエンザ(風邪)感染死者は480人

日本の2012年\第49週12月02日ー12月08日のインフルエンザ(風邪)感染死者は415人

アメリカ合州国の2013年第10週03/03ー03/09の肺炎·インフルエンザ(風邪)感染死者は、0926人。アメリカ合衆国の2012年第35週の08/26から, 2013年第10週の03/09までの122大都市のインフルエンザ(風邪)·肺炎の感染死者報告総数は、2万2823人

アメリカ合州国の2013年第10週03/03ー03/09の肺炎·インフルエンザ(風邪)感染死者は、0926人。アメリカ合衆国の2012年第35週の08/26から, 2013年第10週の03/09までの122大都市のインフルエンザ(風邪)·肺炎の感染死者報告総数は、2万2823人

2013年03月15日金曜日発表
警告! インフルエンザの電網冊子(WEB SITE)には、あなたの電脳機をヴィールス伝染するところがおおいので、アンチヴィールスのソフトを導入したほうがよい。書き込みの妨害や、操作停止や、アクセス不能になる時がある。WINDOWS XPでは、WINDOWS UPDATE, windows defenderを 導入するとよい。
無料のアンチビールスでは、AVG FREE ー ANTIVIRUS DOWNROAD / FREE VIRUS PROTECTION http://www.avg.com
PROGRAMA ANTIVIRUS GRATIS / ANTIVIRUS Y ANTISPYWARE GRATIS / AVG FREE
free.avg.com/es-es/antivirus-grats-avg(スペイン語のソフト?)
avast, Download Free Antivirus Software on Intenet Security
http://www.avast.com
*********************************************************************

US -- Centers for Disease Contrl and Prevention (CDC)
> http://www.cdc.gov/
Publications
> Morbidity and Mortality Weekl Report (MMWR)
MMWR Home
Publications
> Weekly Repot
MMWR Weekly : Current Volume (2012)
March 15, 2013 / Vol. 62  / no. 1 0
> · Notifible Diseases and Mortality Tables
> . Table I, Provisional cases of infrequently reported notifiable diseases ( < 1'000 cases reported during the recently year ) United States, week ending (March 02-) March 09, 2013 (10th Week)
+ Influenza - associated pediatric mortality
Decembr 23-December 29, 2012(52th week) 02,/ acumulated 2012; 52,/ 2011 total; 118,/ 2010 total; 61,/ 2009 total; 358,/ 2008 total; 90,/ 2007 total; 77

> Table III Deaths in 122 U.S. cities, week ending (March 03-) March 09, 2013  (10th Week)
Pneumonia and influenza total daeths are  0926.

アメリカ合州国の2010年/2011年の風邪流行季節の122都市の肺炎·風邪インフルエンザ感染死者数
2010/第35週08/29ー09/04の肺炎·風邪感染死者は、609人。
2010/第36週09/05ー09/11の肺炎·風邪感染死者は、572人。
2010/第37週09/12ー09/18の肺炎·風邪感染死者は、759人。
2010/第38週の09/19ー09/25の肺炎·風邪感 染死者は、674人。
2010/第39週の09/26ー10/02の肺炎·風邪感染死者は、634人。
2010/第40週10/03ー10/09の肺炎·風邪感染死者は, 700人
2010/第41週10/10ー10/16の肺炎·風邪感染死者は、663人。
2010/第42週10/17ー10/23の肺炎·風邪感染死者は、726人。
2010/第43週10/24ー10/30の肺炎·風邪感染死者は、720人。
2010/第44週の10/31ー11/06の肺炎·風邪感 染死者は、736人。
2010/第45週の11/07ー11/13の肺炎·風邪感染死者は、723人。
2010/第46週の11/14ー11/20の肺炎·風邪感染死者は、731人。
2010/第47週の11/21ー11/27の肺炎·風邪感染死者は、516人。
2010/第48週11/28ー12/04の肺炎·風邪感染死者は、796人。
2010/第49週12/05ー12/11の肺炎·風邪感染死者は851人
2010/第50週12/12ー12/19の肺炎·風邪感染死者は、801人。
2010/第51週12/20ー12/26の肺炎·風邪感染死者は、705人。
2010/第52週12/27ー2011/01/02の感染死者は、657人。

2011/第01週の01/02ー01/08の肺炎·風邪感 染死者は、1025人。
2011/第02週の01/09ー01/15の肺炎·風邪感染死者は、 915人。
2011/第03週の01/16ー01/22の肺炎·風邪感 染死者は、 911人。
2011/第04週の01/23ー01/29の肺炎·風邪感染死者は、 983人。
2011/第05週の01/30ー02/05の肺炎·風邪感 染死者は、 934人。
2011/第06週の02/06ー02/12の肺炎·風邪感染死者は、 1080人
2011/第07週の02/13ー02/19の肺炎·風邪感 染死者は、1012人。
2011/第08週の02/20ー02/26の肺炎·風邪感染死者は、 0989人。
2011/第09週の02/27ー03/05の肺炎·風邪感 染死者は、1034人。
2011/第10週の03/06ー03/12の肺炎·風邪感染死者は、 1038人。
2011/第11週の03/13ー03/19の肺炎·風邪感 染死者は、1001人。
2011/第12週の03/20ー03/26の肺炎·風邪感染死者は 、1069人
2011/第13週の03/27ー04/02の肺炎·風邪感 染死者は、0995人。
2011/第14週の04/03ー04/09の肺炎·風邪感染死者は、 0975人。
2011/第15週の04/10ー04/16の肺炎·風邪感 染死者は、0851人。
2011/第16週の04/17ー04/23の肺炎·風邪感染死者は、 0857人。
2011/第17週の04/24ー04/30の肺炎·風邪感 染死者は、0778。
2011/第18週の05/01ー05/07の肺炎·風邪感染死者は、 0842人
2011/第19週の05/08---05/14の肺炎·風邪感染死者は、 0825人
2011/第20週の05/15---05/21の肺炎·風邪感染死者は、 0819人
2011/第21週の05/22ー05/28の肺炎·風邪感染死者は、 0773人
2011/第22週の05/29---06/04の肺炎·風邪感染死者は、 0674人
Update: Influenza Activity --- United states, 2010-- 2011 Season, and Composition of the 2011 --2012 Influenza Vaccine
http://www.cdc.gov/mmwr/preview/mmwrhtml/mm6021a5.htm?s_cid=mm6021a5_w
アメリカ合衆国の2010年ー2011年感染流行期のインフルエンザ風邪感染状況のまとめ
2011/第23週の06/05---06/11の肺炎·風邪感染死者は、 0776人
2011/第24週の06/12---06/18の肺炎·風邪感染死者は、 0737人
2011/第25週の06/19---06/25の肺炎·風邪感染死者は、 0727人
2011/第26週の06/26---07/02の肺炎·風邪感染死者は、 0674人
2011/第27週の07/03ー07/09の肺炎·風邪感染死者は、 0571人
2011/第28週の07/10---07/16の肺炎·風邪感染死者は、 0685人
2011 / 29th Week 07/17--07/23 肺炎·風邪感染死者は, 0723
2011 / 30th Week 07/24--07/30 肺炎·風邪感染死者は, 0721
2011 / 31st Week 07/31--08/06- 肺炎·風邪感染死者は, 0616
2011 / 32nd Week 08/07--08/13-肺炎·風邪感染死者は, 0614
2011 / 33rd Week 08/14--08/20 肺炎·風邪感染死者は, 0616
2011 (34th) Week 08/21--08/27-肺炎·風邪感染死者は, 0619

アメリカ合衆国の2010年ー2011年感染流行期の2010年第35週08月29日ー09月04日から、 2011年第34週08/21ー08/27までのインフルエンザ風邪感染死者数=36'438+3'909=40'347
報告漏れがあるので、実際の2010年/2011年の風邪流行季節の122都市の肺炎·風邪インフルエンザ感染死者数=2010年第35週08月29日ー09月04日からの 2011年第34週08/21ー08/27までの, 肺炎·インフルエンザ感染死者数の総数は、44'000人にはなるだろう。2次感染などによる間
接的なインフルエンザ風邪感染死者も含めると、最高 89'000人にはなるだろう。

********************************************************************************

アメリカ合州国の2011年/2012年の風邪流行季節の122都市の肺炎·風邪インフルエンザ感染死者数=2011年第35週08月28日ー09月03日から2012年第34週07/29ー08/04までの、アメリカ合州国の肺炎·風邪インフルエンザ感染死者数の総計は、37'057.

2011/第35週の08/28ー09/03の風邪感 染死者は、600人。[総計0'600] /全死者数
2011/第36週の09/04ー09/10の風邪感染死者は、 630人。[総計1'230]./全死者数
2011/第37週の09/11ー09/17の風邪感染死者は、672人。[総計1'902]./ 全死者数
2011/第38週の09/18ー09/24の風邪感染死者は、 681人。[総計2'583]./全死者数
2011/第39週の09/25ー10/01の風邪感染死者は、677人。`[総計3'260]./ 全死者数
2011/第40週の10/02ー10/08の風邪感染死者は、 587人. [総計 3'847] /全死者数
2011/第41週の10/09ー10/15の風邪感染死者は、637人。[総計4'484]./全死者数
2011/第42週の10/16ー10/22の風邪感染死者は、 677人。[総計5'161]/全死者数
2011/第43週の10/23ー10/29の風邪感染死者は、675人。[総計5'836]./全死者数
2011/第44週の10/30ー11/05の風邪感染死者は、 690人。[総計6'526]./全死者数
2011/第45週の11/06ー11/12の風邪感 染死者は、607人。[総計7'133]./全死者数
2011/第46週の11/13ー11/19の風邪感染死者は 、753人. [総計7'886]/全死者数
2011/第47週の11/20ー11/26の風邪感 染死者は、536人。[総計8'422]./全死者数
2011/第48週の11/27ー12/03の風邪感染死者は、 801人。[総計9'223]./全死者数
2011/第49週の12/04ー12/10の風邪感 染死者は、744人。[総計9'967]./全死者数
2011/第50週の12/11ー12/17の風邪感染死者は、 764人. [総計 10'731]/全死者数
2011/第51週の12/18ー12/24の風邪感 染死者は、719。 [総計 11'450]./全死者数
2011/第52週の12/25ー12/31の風邪感染死者は、 667人 [総計 12'117]./全死者数

2012/第01週の01/01---01/07の肺炎·風邪感染死者は、 0781人 [総計12'898]./全死者数
2012/第02週の01/08---01/14の肺炎·風邪感染死者は、 0922人 [総計13'820]/全死者数
2012/第03週の01/15ー01/21の肺炎·風邪感染死者は、 0878人.[総計14'698]./全死者数
2012/第04週の01/22ー01/28の肺炎·風邪感 染死者は、0917。 [総計15'615]./全死者数
2012/第05週の01/29ー02/04の肺炎·風邪感染死者は, 0 923人 [総計16'538]./全死者数
2012/第06週の02/05---02/11の肺炎·風邪感染死者は、 0754人 [総計17'292]./全死者数
2012/第07週の02/12---02/18の肺炎·風邪感染死者は、 0857人 [総計18'149]./全死者数
2012/第08週の02/19---02/25の肺炎·風邪感染死者は、 0832人 [総計18'981]./全死者数
2012/第09週の02/26---03/03の肺炎·風邪感染死者は、 0901人 [総計19'882]./全死者数
2012/第10週の03/04ー03/10の肺炎·風邪感染死者は、 0855人[総計 20'737]./全死者数
2012/第11週の03/11ー03/17の肺炎·風邪感 染死者は、0864。 [総計21'601]./全死者数
2012/第12週の03/18ー03/24の肺炎·風邪感染死者は, 0891人 [総計22'492]./全死者数
2012/第13週の03/25---03/31の肺炎·風邪感染死者は、 0778人 [総計23'270]./全死者数
2012/第14週の04/01---04/07の肺炎·風邪感染死者は、 0727人 [総計23'997]./全死者数
2012/第15週の04/08ー04/14の肺炎·風邪感染死者は、 0774人[総計 24'771]./全死者数
2012/第16週の04/15ー03/21の肺炎·風邪感 染死者は、0765。[総計 25'536]./全死者数
2012/第17週の04/22ー04/28の肺炎·風邪感染死者は, 0794人 [総計 26'330]. /全死者数
2012/第18週04/29-05/05肺炎·風邪感染死者0718人 [総計27'048],(風邪死者は全死者数の6'93%)
/2012第18週全死者数; 10'361, <65 01-24="" 01="" 206="" 25-44="" 2="" 45-64="" 581="" 6="">; 195
2012/第19週05/06-05/12肺炎·風邪感染死者0655人[総計27'703], (風邪死者は全死者数の6'12%)
/ 2012第19週全死者数; 10'707,<65: 01-24="" 1="" 210="" 25-44="" 2="" 45-64="" 634="" 7="">; 186
2012/第20週05/13-05/19肺炎·風邪感染死者0685人[総計28'388], (風邪死者は全死者数の6'38%)
/ 2012第20週全死者数; 10'728,<65: 01-24="" 1="" 229="" 25-44="" 2="" 45-64="" 613="" 7="">; 210
2012/第21週05/20-05/26肺炎·風邪感染死者0706人[総計29'094], (風邪死者は全死者数の6'59%)
/ 2012第21週全死者数; 10'709,<65: 01-24="" 1="" 228="" 25-44="" 2="" 45-64="" 612="" 7="">; 185
2012/第22週05/27-06/02肺炎·風邪感染死者0553人[総計29'647], (風邪死者は全死者数の5'99%)
/ 2012第22週全死者数; 09'228,<65: 01-24="" 1="" 228="" 25-44="" 2="" 45-64="" 565="" 6="">; 190
2012/第23週06/03-06/09肺炎·風邪感染死者0707人[総計30'354], (風邪死者は全死者数の6'28%)
/ 2012第23週全死者数; 11'260,<65: 01-24="" 1="" 240="" 25-44="" 2="" 45-64="" 678="" 7="">; 192
2012/第24週06/10-06/16肺炎·風邪感染死者0634人[総計30'988], (風邪死者は全死者数の6'28%)
/ 2012第24週全死者数; 10'091,<65: 01-24="" 1="" 224="" 25-44="" 2="" 45-64="" 631="" 6="">; 168
2012/第25週06/17-06/23肺炎·風邪感染死者0646人[総計31'634], (風邪死者は全死者数の6'11%)
/ 2012第25週全死者数; 10'578,<65: 01-24="" 1="" 217="" 25-44="" 2="" 45-64="" 634="" 7="">; 174

2012/第26週06/24-06/30肺炎·風邪感染死者0675人[総計32'309], (風邪死者は全死者数の6'56%)
/ 2012第26週全死者数; 10'283,<65: 01-24="" 1="" 248="" 25-44="" 2="" 45-64="" 632="" 6="">; 183
2012/第27週07/01-07/07肺炎·風邪感染死者0539人[総計32'848], (風邪死者は全死者数の6'10%)
/ 2012第27週全死者数; 08'832,<65: 01-24="" 182="" 1="" 25-44="" 2="" 45-64="" 492="" 5="">; 164
2012/第28週07/08-07/14肺炎·風邪感染死者0644人[総計33'492], (風邪死者は全死者数の5'96%)
/ 2012第28週全死者数; 10'805,<65: 01-24="" 1="" 25-44="" 284="" 2="" 45-64="" 664="" 7="">; 198
2012/第29週07/15-07/21肺炎·風邪感染死者0592人[総計34'084], (風邪死者は全死者数の5'62%)
/ 2012第29週全死者数; 10'541,<65: 01-24="" 1="" 25-44="" 253="" 2="" 45-64="" 659="" 6="">; 200

2012/第30週07/22-07/28肺炎·風邪感染死者0575人[総計34'659], (風邪死者は全死者数の5'62%)
/ 2012第30週全死者数; 10'237,<65: 01-24="" 1="" 25-44="" 271="" 2="" 45-64="" 642="" 6="">; 191

2012/第31週07/29-08/04肺炎·風邪感染死者0585人[総計35'244], (風邪死者は全死者数の5'79%)
???/ 2012第31週全死者数; 10'107,<65: 01-24="" 1="" 247="" 25-44="" 2="" 45-64="" 604="" 6="">; 196


2012/第032週の08/05-08/11の肺炎·風邪感染死者は、 0588人 [総計35'832]/全死者数
2012第32週全死者数; 10'274,<65: 01-24="" 1="" 238="" 25-44="" 2="" 45-64="" 602="" 6="">; 178

2012/第033週の08/12ー08/18の肺炎·風邪感染死者は、 0616人.[総計36'448]./全死者数
2012第33週全死者数; 10'170,<65: 01-24="" 194="" 1="" 25-44="" 2="" 45-64="" 604="" 6="">; 184

2012/第34週の08/19ー08/25の肺炎·風邪感 染死者は、0609。 [総計37'057]./全死者数
2012第34週全死者数; 10'934,<65: 01-24="" 1="" 25-44="" 252="" 2="" 45-64="" 692="" 7="">; 233


アメリカ合衆国の2011年ー2012年感染流行期の2011年第35週08月28日ー09月03日から、 2012年第34週08/19ー08/25までのインフルエンザ風邪感染死者数=37'057
報告漏れがあるので、実際の2011年/2012年の風邪流行季節の122都市の肺炎·風邪インフルエンザ感染死者数=2011年第35週08月28日ー09月03日から 2012年第34週08/19ー08/25までの, 肺炎·インフルエンザ感染死者数の総数は、41'000人にはなるだろう。2次感染などによる間
接的なインフルエンザ風邪感染死者も含めると、最高 82'000人にはなるだろう。

January 13, 2012 / Vol.61 / no.1
·QuickStats : Death Rate from Suicide for Persons Aged 45-64 Years, by Black or White Race and sex - United states, 1999 - 2008
http://www.cdc.gov/mmwr/preview/mmwrhtml/mm6101a6.htm?s_cid=mm6101a6_w

February 24, 2012 / Vol. 61 / No. 07 / pg. 113 - 132
·Influenza Vaccination Coverage Among Pregnant Women - 29 States and New York city, 2009-2010 Season
http://www.cdc.gov/mmwr/preview/mmwrhtml/mm6107a1.htm?s_cid=mm6107a1_w
·Update : Influenza Activity --- United States, October 2, 2011 - February 11, 2012

April 6, 2012 / Vol.61 / No.13
·Influenza Outbreaks at Two Correctional Facilities, Maine, March 2011
http://www.cdc.gov/mmwr/preview/mmwrhtml/mm6113a3.htm?s_cid=mm6113a3_w

April 13, 2012 / Vol.61 / No.14
·Antibodies Cross-Reactive to Influenza A(H3N2) Variant Virus and Impact of 2010-2011 seasonal Influenza Vaccine on Cross-Reactive Antibodies - United States
http://www.cdc.gov/mmwr/preview/mmwrhtml/mm6114a1.htm?s_cid=mm6114a1_w


April 27, 2012 & Vol.61 & No.16
·Severe Coinfection with seasonal Influenza A(H3N2) Virus and Staphylococcus aureus - Maryland, February - March 2012
http://www.cdc.gov/mmwr/preview/mmwrhtml/mm6116a4.htm?s_cid=mm6116a4_w

June 08, 2012 / Vol. 61 / No. 61 / No. 22
· Update : Influenza Activity -- United States, 2011-2012 season and composition of the 2012-13 Influenza Vaccine

http://www.cdc.gov/mmwr/preview/mmwrhtml/mm6122a4.htm?s_cid=mm6122a4_w

July 27, 2012 & Vol.61 & No.29
·Notes fron the Field : Outbreak of influenza A(H3N2) Virus Among Persons and Swine at a County Fair - Indiana, July 2012
http://www.cdc.gov/mmwr/preview/mmwrhtml/mm6129a5.htm?s_cid=mm6129a5_w

August 17, 2012 / Vol.61 / No.32
· Prevention and Control of Influenza with Vaccines : Recommendationes of the Adversory Committee on ImmunizationPractices (ACIP) - United Staes, 2012 - 2013 Influenza Season

http://www.cdc.gov/mmwr/preview/mmwrhtml/mm6132a3.htm?s_cid=mm6132a3_w

· Evaluation of Rapid Influenza Diagnostic Tests for Influenza A (H3N2) v Virus and Updated Case Count - United States, 2012

http://www.cdc.gov/mmwr/preview/mmwrhtml/mm6132a4.htm?s_cid=mm6132a4_w

August 24, 2012 / Vol.61 / No.33
·Quick Stats : Rate of Hospitalization for Pneumonia by Age Group National Hospital Discharge Survey, United Staes, 2000 - 2010

http://www.cdc.gov/mmwr/preview/mmwrhtml/mm6133a4.htm?s_cid=mm6133a4_w


\\\\\\\\\\\\\\\\\\\\\\\\\\\\\\\\\\\\\\\\\\\\\\\\\\\\\\\\\\\\\\\\\\\\\\\\\\\\\\\\\\\\\\\\\\\\\\\\\\\\\\\\\\\\\\\\\\\\\\\\\\\\\\\\\\\\\\

アメリカ合州国の2012年/2013年の風邪流行季節の122都市の肺炎·風邪インフルエンザ感染死者数=2012年第35週08月26日ー09月01日から、今までの 2013年第10週03/03ー03/09までの、アメリカ合州国の肺炎·風邪インフルエンザ感染死者数の報告総計は、22'823.


2012/第35週08/26-09/01肺炎·風邪感染死者 0594人 [総計00'594]./風邪死者は全死者の5'57%数
2012第35週全死者数; 10'669,<65: 01-24="" 1="" 224="" 25-44="" 2="" 45-64="" 660="" 7="">; 202

2012/第36週09/02-09/08肺炎·風邪感染死者 0588人 [総計01'182]./風邪死者は全死者の5'95%数
2012第36週全死者数; 9'874,<65: 01-24="" 1="" 224="" 25-44="" 2="" 45-64="" 622="" 6="">; 181

2012/第37週09/12-09/15肺炎·風邪感染死者 0691人 [総計1'873]./風邪死者は全死者の6'27%数
2012第37週全死者数; 11'016,<65: 01-24="" 1="" 243="" 25-44="" 2="" 45-64="" 642="" 7="">; 197

2012/第38週09/16-09/22肺炎·風邪感染死者 0648人 [総計2'521]./風邪死者は全死者の6'15%数
2012第38週全死者数; 10'537,<65: 01-24="" 1="" 238="" 25-44="" 2="" 45-64="" 583="" 6="">; 214

2012/第39週09/23-09/29肺炎·風邪感染死者 0691人 [総計3'212]./風邪死者は全死者の6'25%数
2012第39週全死者数; 11'048,<65: 01-24="" 1="" 215="" 25-44="" 2="" 45-64="" 598="" 7="">; 198

2012/第40週09/30-10/06肺炎·風邪感染死者 0623人[総計 3'835]./風邪死者は全死者の5'90%数
2012第40週全死者数; 10'562,<65: 01-24="" 1="" 228="" 25-44="" 2="" 45-64="" 621="" 6="">; 193

2012/第41週10/07-10/13肺炎·風邪感 染死者0636。 [総計4'471]./風邪死者は全死者の6' 28%数
2012第41週全死者数; 10'117,<65: 01-24="" 1="" 208="" 25-44="" 2="" 45-64="" 580="" 6="">; 160

2012/第42週10/14-10/20肺炎·風邪感染死者 0679人 [総計5'150]./風邪死者は全死者数の5'70%
2012第42週全死者数; 11'899,<65: 01-24="" 1="" 248="" 25-44="" 2="" 45-64="" 696="" 7="">; 234

2012/第43週10/21-10/27肺炎·風邪感染死者 0638人 [総計5'788]./風邪死者は全死者の6'50%数
2012第43週全死者数; 09'816,<65: 01-24="" 194="" 1="" 25-44="" 2="" 45-64="" 568="" 6="">; 171

2012/第44週04/01-04/07肺炎·風邪感染死者 0681人 [総計6'469]./風邪死者は全死者の6'59%数\
2012第44週全死者数; 10'336,<65: 01-24="" 1="" 229="" 25-44="" 2="" 45-64="" 580="" 6="">; 191

2012/第45週11/04-11/10肺炎·風邪感染死者0724人[総計 7'193]./風邪死者は全死者の6'38%数
2012第45週全死者数; 11'348,<65: 01-24="" 1="" 228="" 25-44="" 2="" 45-64="" 614="" 7="">; 200

2012/第46週11/11-11/17肺炎·風邪感 染死者0687 [総計 7'880]./風邪死者は全死者の6'40%数
2012第46週全死者数; 10'724,<65: 01-24="" 1="" 208="" 25-44="" 2="" 45-64="" 616="" 7="">; 190
2012/第47週11/18-11/24肺炎·風邪感染死0549人 [総計 08'429]. /風邪死者は全死者数の6'93%
2012第47週全死者数; 08'773,<65: 01-24="" 161="" 1="" 25-44="" 45-64="" 497="" 5="">; 149

2012/第48週11/25-12/01肺炎·風邪感染死者0812人 [総計09'241],(風邪死者は全死者数の6'93%)
/2012第48週全死者数; 12'466, <65 01-24="" 01="" 25-44="" 260="" 2="" 45-64="" 700="" 8="">; 197

2012/第49週12/02-12/08肺炎·風邪感染死者0739人[総計09'980], (風邪死者は全死者数の6'12%)
/ 2012第49週全死者数; 11'627,<65: 01-24="" 1="" 234="" 25-44="" 2="" 45-64="" 613="" 7="">; 203

2012/第50週12/09-12/15肺炎·風邪感染死者0783人[総計10'763], (風邪死者は全死者数の6'38%)
2012第50週全死者数; 11'651,<65: 01-24="" 1="" 237="" 25-44="" 2="" 45-64="" 642="" 7="">; 204

2012/第51週12/16-12/22肺炎·風邪感染死者0676人[総計11'439], (風邪死者は全死者数の6'38%)
2012第51週全死者数; 10'396,<65: 01-24="" 167="" 1="" 25-44="" 2="" 45-64="" 556="" 7="">; 181

2012/第52週12/23-12/29肺炎·風邪感染死者0523人[総計11'962], (風邪死者は全死者数の6'38%)
2012第52週全死者数; 07'484,<65: 01-24="" 124="" 1="" 25-44="" 444="" 45-64="" 5="">; 102


2013/第01週12/30-01/05肺炎·風邪感染死者0801人[総計12'763], (風邪死者は全死者数の6'27%)
2013第01週全死者数; 10'984,<65: 01-24="" 192="" 1="" 25-44="" 2="" 45-64="" 593="" 7="">; 153
2013/第02週01/06-01/12肺炎·風邪感染死者 1213人 [総計13'976]./風邪死者は全死者数の8'68%
2013第02週全死者数; 14'678,<65: 01-24="" 10="" 1="" 25-44="" 298="" 3="" 45-64="" 784="">; 219

2013/第03週01/13-01/19肺炎·風邪感染死者 1373人 [総計15'349]./風邪死者は全死者の8'94%
2013第03週全死者数; 13'973,<65: 01-24="" 1="" 241="" 25-44="" 3="" 45-64="" 683="" 9="">; 195

2013/第04週01/20-01/26肺炎·風邪感染死者 1'213人 [総計16'562]./風邪死者は全死者の9'41%\
2013第04週全死者数; 12'883,<65: 01-24="" 1="" 233="" 25-44="" 2="" 45-64="" 648="" 8="">; 178

2013/第05週01/27-02/02肺炎·風邪感染死者1246人[総計 17'1808]./風邪死者は全死者の8'99%数
2013第05週全死者数; 13'852,<65: 01-24="" 1="" 25-44="" 251="" 3="" 45-64="" 696="" 9="">; 195

2013/第06週02/03-02/09肺炎·風邪感 染死者1'125 [総計18'933]./風邪死者は全死者の9'07%数
2013第06週全死者数; 12'407,<65: 01-24="" 1="" 223="" 25-44="" 2="" 45-64="" 650="" 8="">; 196
2013/第07週02/10-02/16肺炎·風邪感染死1077人 [総計 20'010]. /風邪死者は全死者数の8'55%
2013第07週全死者数; 12'591,<65: 01-24="" 1="" 215="" 25-44="" 2="" 45-64="" 642="" 8="">; 156

2013/第08週02/17-02/23 肺炎·風邪感染死者0947人 [総計20'957],(風邪死者は全死者数の8'36%)
/2032第08週全死者数; 11'325, <65 01-24="" 01="" 188="" 25-44="" 2="" 45-64="" 578="" 7="">; 189

2013/第09週02/24-03/02肺炎·風邪感染死者0940人[総計21'897], (風邪死者は全死者数の7'73%)
/ 2013第09週全死者数; 12'157,<65: 01-24="" 1="" 222="" 25-44="" 2="" 45-64="" 630="" 8="">; 207

2013/第10週03/03-03/09 肺炎·風邪感染死者0926人[総計22'823], (風邪死者は全死者数の7'60%)
2013第10週全死者数; 12'182,<65: 01-24="" 1="" 207="" 25-44="" 2="" 45-64="" 631="" 8="">; 191

アメリカ合州国の2012年/2013年の風邪流行季節の122都市の肺炎·風邪インフルエンザ感染死者数=2012年第35週08月26日ー09月01日から、今までの 2013年第10週03/03--03/09までの、アメリカ合州国の肺炎·風邪インフルエンザ感染死者数の報告総計は、22'823
   報告漏れがあるので、実際の2012年/2013年の風邪流行季節の122都市の肺炎·風邪インフルエンザ感染死者数=2012年第35週08月26日ー09月01日から、今までの 2013年第10週03/03ー03/09までの, 肺炎·インフルエンザ感染死者数の総数は、25'100人にはなるだろう。2次感染などによる間接的なインフルエンザ風邪感染死者も含めると、最高 50'200人にはなるだろう。
-----------------------------------------------------------------------------------------------------


Feburuary 22, 2013 & Vol.62 / No.
· Update : Influenza Activity - United States, September 30, 2012 - February 09, 2013
 
http://www.cdc.gov/mmwr/preview/mmwrhtml/mm6207a3.htm?s_cid=mm6207a3_w
 
January 18, 2013
· Early Estimates of  of Seasonal Infulenza Vaccine Effectiveness, January 2013
 
http://www.cdc.gov/mmwr/preview/mmwrhtml/mm6202a4.htm?s_cid=mm6202a4_w

December 7, 2012 / Vol.61 / No.48
·Update : Influenza activity - United states, september 30 - November 24, 2012
http://www.cdc.gov/mmwr/preview/mmwrhtml/mm6148a3.htm?s_cid=mm6148a3_w

November 30, 2012 / Vol.61 / No.47
·Announcement : National Influenza Vaccination week - December 2-8, 2012
http://www.cdc.gov/mmwr/preview/mmwrhtml/mm6147a6.htm?s_cid=mm6147a6_w

November 9, 2012 / Vol.61 / No.44
·Announcement : World Pneumonia Day - November 12, 2012
http://www.cdc.gov/mmwr/preview/mmwrhtml/mm6144a6.htm?s_cid=mm6144a6_w

November 2, 2012 / Vol.61 / No.43
·Evaluation of 11 Commercially Available Rapid Influenza Diagnostic Tests - United states, 2011-2012
http://www.cdc.gov/mmwr/preview/mmwrhtml/mm6143a3.htm?s_cid=mm6143a3_w

October 12, 2012 / Vol.61 / No.40
·QuickStates : Percentage of Hospitalizations Ending in death, by Selected First-Listed Diagnoses - National Hospital Discharge Survey, United States 2000 and 2010
http://www.cdc.gov/mmwr/preview/mmwrhtml/mm6140a8.htm?s_cid=mm6140a8_w

October 5, 2012 / Vol.61 / No.39
·Update: Influenza Activity - United States and Worldwide, May 20, 2012 - September 22, 2012
http://www.cdc.gov/mmwr/preview/mmwrhtml/mm6139a3.htm?s_cid=mm6139a3_w

September 28, 2012 / Vol.61 / No.38
·Influenza Vacination Coverage Among Health-Care Personal - 2011-2012 Influenza Season, United States
http://www.cdc.gov/mmwr/preview/mmwrhtml/mm6138a1.htm?s_cid=mm6138a1_w

·Influenza Vaccination Coverage Among Pregnant Women - 2011-2012 Influenza Season, United States
http://www.cdc.gov/mmwr/preview/mmwrhtml/mm6138a2.htm?s_cid=mm6138a2_w

·Influenza A(H3N2) Variant Virus - Related Hospitalizations - Ohio, 2012
http://www.cdc.gov/mmwr/preview/mmwrhtml/mm6138a3.htm?s_cid=mm6138a3_w

·Announcements : Final State-Level 2011-2012 Influenza Vaccination Coverage Estimates Available Online
http://www.cdc.gov/mmwr/preview/mmwrhtml/mm6138a5.htm?s_cid=mm6138a5_w


September 14, 2012 / Vol.61 / No.36
·Notes from the Field : Highly Pathogenic Avian Influenza A(H7N3) Virus Infection in Two Poultry Workers - Jalisco, Mexico, July 2012

http://www.cdc.gov/mmwr/preview/mmwrhtml/mm6136a4.htm?s_cid=mm6136a4_w

August 17, 2012 / Vol.61 / No.32
· Prevention and Control of Influenza with Vaccines : Recommendationes of the Adversory Committee on ImmunizationPractices (ACIP) - United Staes, 2012 - 2013 Influenza Season

http://www.cdc.gov/mmwr/preview/mmwrhtml/mm6132a3.htm?s_cid=mm6132a3_w

· Evaluation of Rapid Influenza Diagnostic Tests for Influenza A (H3N2) v Virus and Updated Case Count - United States, 2012

http://www.cdc.gov/mmwr/preview/mmwrhtml/mm6132a4.htm?s_cid=mm6132a4_w

August 24, 2012 / Vol.61 / No.33
·Quick Stats : Rate of Hospitalization for Pneumonia by Age Group National Hospital Discharge Survey, United Staes, 2000 - 2010

http://www.cdc.gov/mmwr/preview/mmwrhtml/mm6133a4.htm?s_cid=mm6133a4_w

July 27, 2012 & Vol.61 & No.29
·Notes fron the Field : Outbreak of influenza A(H3N2) Virus Among Persons and Swine at a County Fair - Indiana, July 2012

http://www.cdc.gov/mmwr/preview/mmwrhtml/mm6129a5.htm?s_cid=mm6129a5_w


June 08, 2012 / Vol. 61 / No. 61 / No. 22
· Update : Influenza Activity -- United States, 2011-2012 season and composition of the 2012-13 Influenza Vaccine

http://www.cdc.gov/mmwr/preview/mmwrhtml/mm6122a4.htm?s_cid=mm6122a4_w

April 27, 2012 & Vol.61 & No.16
·Severe Coinfection with seasonal Influenza A(H3N2) Virus and Staphylococcus aureus - Maryland, February - March 2012
http://www.cdc.gov/mmwr/preview/mmwrhtml/mm6116a4.htm?s_cid=mm6116a4_w

April 13, 2012 / Vol.61 / No.14
·Antibodies Cross-Reactive to Influenza A(H3N2) Variant Virus and Impact of 2010-2011 seasonal Influenza Vaccine on Cross-Reactive Antibodies - United States
http://www.cdc.gov/mmwr/preview/mmwrhtml/mm6114a1.htm?s_cid=mm6114a1_w

April 6, 2012 / Vol.61 / No.13
·Influenza Outbreaks at Two Correctional Facilities, Maine, March 2011
http://www.cdc.gov/mmwr/preview/mmwrhtml/mm6113a3.htm?s_cid=mm6113a3_w

September 16,2011 / V0l.60 / N0. 36 /Pg. 1233--1268
. Update : Influenza Activity --- United States and Wordwide, May 22--September 3, 2011
http://www.cdc.gov/mmwr/preview/mmwrhtml/mm6036a2.htm?s_cid=mm6036a2_w

February 24, 2012 / Vol. 61 / No. 07 / pg. 113 - 132
·Influenza Vaccination Coverage Among Pregnant Women - 29 States and New York city, 2009-2010 Season
http://www.cdc.gov/mmwr/preview/mmwrhtml/mm6107a1.htm?s_cid=mm6107a1_w
·Update : Influenza Activity --- United States, October 2, 2011 - February 11, 2012

December 9, 2011 / Vol. 60 / No. 48 / Pg. 1641 - 1672
. Update : Influenza Activity --- United States, October -- November 26, 201
http://www.cdc.gov/mmwr/preview/mmwrhtml/mm6048a2.htm?s_cid=mm6048a2_w
February 24, 2012 / Vol. 61 / No. 07 / pg. 113 - 132
·Update : Influenza Activity --- United States, October 2, 2011 - February 11, 2012

アメリカ合衆国の2013年1月のインフルエンザ(風邪)予防注射の効果の程の予想

アメリカ合衆国の2013年1月のインフルエンザ(風邪)予防注射の効果の程の予想

CDC

Centers for Disease Cntrol and Prevention

Morbidity and Mortakity Weekly Report

published on January 18, 2013

# Early Estimates of Seasonal Influenza Vaccine Effectiveness in the United States in January 2013

http://www.cdc.gov/mmwr/preview/mmwrhtml/mm6202a4.htm?s_cid=mm6202a4_w

アメリカ合衆国の2012年9月30日から2013年2月9日までのインフルエンザ(風邪)感染状況のまとめ

アメリカ合衆国の2012年9月30日から2013年2月9日までのインフルエンザ(風邪)感染状況のまとめ

CDC

Centers for Disease Control and Prevention in U.S.A.

Morbidity and Mortality Weekly Report

published on February 22, 2013

Update > Influenza Activity in the United States from September 9, 2012 to February 9, 2013


http://www.cdc.gov/mmwr/preview/mmwrhtml/mm6207a3.htm?s_cid=mm6207a3_w

Update: Influenza Activity — United States, September 30, 2012–February 9, 2013


Weekly


February 22, 2013 / 62(07);124-130

Influenza activity in the United States began to increase in mid-November and remained elevated through February 9, 2013. During that time, influenza A (H3N2) viruses predominated overall, followed by influenza B viruses. This report summarizes U.S. influenza activity* since the beginning of the 2012–13 influenza season and updates the previous summary (1).
Viral Surveillance
During September 30, 2012–February 9, 2013, approximately 140 World Health Organization (WHO) and National Respiratory and Enteric Virus Surveillance System collaborating laboratories in the United States tested 203,706 respiratory specimens for influenza viruses; 55,470 (27.2%) were positive (Figure 1). Of these, 44,035 (79%) were influenza A viruses, and 11,435 (21%) were influenza B viruses. Of the 44,035 influenza A viruses, 29,914 (68%) were subtyped; 29,091 (97%) of these were influenza A (H3) viruses, and 823 (3%) were influenza A (H1N1)pdm09 (pH1N1) viruses. The percentage of specimens testing positive for influenza increased through the week ending December 29, 2012 (week 52), when 38.1% tested positive, and decreased subsequently. In the week ending February 9, 2013 (week 6), 19.7% of specimens tested positive. Since the start of the influenza season to February 9, 2013, influenza A (H3) viruses predominated in the United States overall, followed by influenza B viruses, while pH1N1 viruses were identified less frequently.
Novel Influenza A Viruses
One infection with an influenza A (H3N2) variant virus (H3N2v) was reported to CDC during the week ending December 8, 2012 (week 49) from Minnesota. Close contact between the patient and swine in the week preceding illness was reported. The patient fully recovered, and no further cases were identified in contacts of the patient. This is the second H3N2v infection reported for the 2012–13 influenza season (1).
Antigenic Characterization
WHO collaborating laboratories in the United States are requested to submit a subset of their influenza-positive respiratory specimens to CDC for further antigenic characterization. CDC has antigenically characterized 1,088 influenza viruses collected during the 2012–13 season, including 86 pH1N1, 677 influenza A (H3N2), and 325 influenza B viruses. All pH1N1 viruses were characterized as A/California/7/2009-like (H1N1), which is the 2012–13 influenza A (H1N1) component of the 2012–13 Northern Hemisphere vaccine. A total of 673 (99.4%) of the 677 influenza A (H3N2) viruses were characterized as A/Victoria/361/2011-like (H3N2), the influenza A (H3N2) component of the 2012–13 Northern Hemisphere vaccine. Of the 325 influenza B viruses tested, 230 (71%) belong to the B/Yamagata lineage and were characterized as B/Wisconsin/1/2010-like, the influenza B component of the 2012–13 Northern Hemisphere vaccine; 95 (29%) of the influenza B viruses tested belong to the B/Victoria lineage of viruses.
Antiviral Resistance of Influenza Virus Isolates
Since October 1, 2012, a total of 1,702 influenza viruses have been tested for resistance to influenza antiviral medications. None of the 1,072 influenza A (H3N2) or the 396 influenza B viruses was resistant to either oseltamivir or zanamivir. Among 234 pH1N1 viruses tested for resistance to oseltamivir, two (0.9%) were found to be resistant, and of the 97 viruses tested for resistance to zanamivir, none were found to be resistant, including one of the two oseltamivir-resistant pH1N1 viruses. Additional laboratory testing, including testing for resistance to zanamvir, is pending on the second oseltamivir-resistant pH1N1 virus. High levels of resistance to the adamantanes persist among pH1N1 and influenza A (H3N2) viruses.
Outpatient Illness Surveillance
Since September 30, 2012, the weekly percentage of outpatient visits for influenza-like illness (ILI) reported by approximately 1,900 U.S. Outpatient ILI Surveillance Network (ILINet) providers in 50 states, New York City, Chicago, the U.S. Virgin Islands, and the District of Columbia that comprise ILINet, has ranged from 1.2% to 6.1%. From the week ending November 24, 2012 (week 47) to February 9, 2013 (week 6), the percentage equaled or exceeded the national baseline§ of 2.2% for 12 consecutive weeks (Figure 2). During the 1997–98 through 2011–12 seasons, peak weekly percentages of outpatient visits for ILI ranged from 2.4% to 7.7% and remained above baseline levels for an average of 12 weeks (range: 1–18 weeks). For the week ending February 9, 2013 (week 6), all 10 U.S. Department of Health and Human Services regions continued to report ILI activity above region-specific baseline levels.
Data collected in ILINet are used to produce a measure of ILI activity** by jurisdiction. During the week ending February 9, 2013 (week 6), 11 states and New York City experienced high ILI activity (Alabama, California, Idaho, Kansas, Michigan, Missouri, Nevada, New Jersey, Texas, Utah, and Vermont), 10 states experienced moderate ILI activity (Arizona, Colorado, Illinois, Indiana, Louisiana, Minnesota, North Dakota, Oregon, South Dakota, and Virginia), 13 states and the District of Columbia experienced low ILI activity (Arkansas, Florida, Georgia, Hawaii, Iowa, Massachusetts, Mississippi, Nebraska, New Mexico, New York, Oklahoma, Washington, and Wyoming), and 16 states experienced minimal ILI activity (Alaska, Connecticut, Delaware, Kentucky, Maine, Maryland, Montana, New Hampshire, North Carolina, Ohio, Pennsylvania, Rhode Island, South Carolina, Tennessee, West Virginia, and Wisconsin). As of February 9, 2013, the largest total number of jurisdictions experiencing high ILI activity in a single week occurred during the week ending December 29, 2012 (week 52), when a total of 33 states and New York City experienced high ILI activity. The total number of jurisdictions experiencing high ILI activity in a single week during the 2008–09 through 2011–12 influenza seasons has ranged from four to 18 jurisdictions, excluding the 2009 pandemic, when 44 jurisdictions reported high ILI activity (CDC, unpublished data, 2013).
Geographic Spread of Influenza
For the week ending February 9, 2013 (week 6), the geographic spread of influenza†† was reported as widespread in 31 states (Alaska, Arizona, Arkansas, California, Colorado, Connecticut, Florida, Idaho, Illinois, Indiana, Iowa, Kansas, Maine, Maryland, Massachusetts, Michigan, Missouri, Montana, New Hampshire, New Jersey, New Mexico, New York, Ohio, Oklahoma, Oregon, Pennsylvania, Utah, Virginia, Washington, Wisconsin, and Wyoming), regional in Puerto Rico and 14 states (Alabama, Hawaii, Kentucky, Louisiana, Minnesota, Nebraska, Nevada, North Dakota, South Carolina, South Dakota, Tennessee, Texas, Vermont, and West Virginia), and local in the District of Columbia and four states (Georgia, Mississippi, North Carolina, and Rhode Island). Sporadic influenza activity was reported by Guam and one state (Delaware), and the U.S. Virgin Islands did not report. As of February 9, 2013, the number of jurisdictions reporting influenza activity as widespread peaked during the week ending January 12, 2013 (week 2), when a total of 48 jurisdictions reported influenza activity as widespread. The number of states reporting widespread activity during the peak week of activity has ranged from 25 to 49 states during the previous five influenza seasons (CDC, unpublished data, 2013).
Influenza-Associated Hospitalizations
CDC monitors hospitalizations associated with laboratory-confirmed influenza infection in adults and children through the Influenza Hospitalization Surveillance Network (FluSurv-NET),§§ which covers approximately 9% of the U.S. population. From October 1, 2012, to February 9, 2013, a total of 8,953 laboratory-confirmed influenza associated hospitalizations were reported, with a cumulative incidence for all age groups of 32.1 per 100,000 population. The most affected age group was persons aged ≥65 years, accounting for more than 50% of reported influenza-associated hospitalizations. The cumulative hospitalization rate (per 100,000 population) from October 1, 2012, to February 9, 2013, was 44.0 among children aged 0–4 years, 9.3 among children aged 5–17 years, 11.6 among adults 18–49 years, 29.4 among adults aged 50–64 years, and 146.2 among adults aged ≥65 years (Figure 3). During the past three influenza seasons (2009–10 through 2011–12), end-of-season age-specific cumulative hospitalization rates ranged from 14.8 to 73.0 per 100,000 population for ages 0–4 years, 4.0 to 27.3 for ages 5–17 years, 4.1 to 23.3 for ages 18–49 years, 8.3 to 30.4 for ages 50–64 years, and 25.3 to 64.0 for ages ≥65 years. During the 2005–06 to the 2008–09 influenza seasons, end-of-season hospitalization rates among adults aged ≥65 years ranged from 13.5 to 73.8 per 100,000 population.
For the current season, the most commonly reported underlying medical conditions among hospitalized adults were cardiovascular disease, metabolic disorders, obesity, and chronic lung disease (excluding asthma). The most commonly reported underlying medical conditions in hospitalized children were asthma, neurologic disorders, and immune suppression. Forty-four percent of hospitalized children had no identified underlying medical conditions that place them at higher risk for influenza complications.¶¶ Among 218 hospitalized women of childbearing age (15–44 years), 63 (29%) were pregnant.
Pneumonia and Influenza-Associated Mortality
For the week ending February 9, 2013 (week 6), pneumonia and influenza (P&I) was reported as an underlying or contributing cause of death for 9.1% of all deaths reported to the 122 Cities Mortality Reporting System (Figure 4). This percentage is above the epidemic threshold of 7.5% for that week.*** Since September 30, 2012, the weekly percentage of deaths attributed to P&I ranged from 5.8% to 9.9%, and, as of February 9, 2013 (week 6), had exceeded the epidemic threshold for 6 consecutive weeks (weeks ending January 5–February 9, 2013 [weeks 1–6]). As of February 9, 2013, the weekly percentage of deaths attributed to P&I peaked at 9.9% during the week ending January 19, 2013 (week 3). Peak weekly percentages of deaths attributed to P&I in the previous five seasons ranged from 7.9% for the 2008–09 and 2011–12 seasons to 9.1% during the 2007–08 and 2010–11 seasons.
Influenza-Associated Pediatric Mortality
As of February 9, 2013, a total of 64 laboratory-confirmed influenza-associated pediatric deaths occurring during the 2012–13 season had been reported to CDC from Chicago, New York City, and 27 states. The mean and median ages of children reported to have died were 7.9 and 7.4 years, respectively; three children were aged <6 11="" 122="" 12="" 15="" 16="" 18="" 19="" 2004="" 2009="" 2010.="" 2013="" 20="" 24="" 29="" 2="" 348="" 34="" 5="" 64="" 6="" a="" aged="" an="" and="" approximately="" april="" associated="" b="" became="" began="" cdc="" children="" collection="" complications="" data="" death="" deaths="" died="" disease="" during="" each="" eight="" eligible="" excluding="" from="" had="" has="" in="" infection.="" infection="" influenza-associated="" influenza="" months="" mortality="" nationally="" not="" notifiable="" number="" october="" of="" p="" pandemic="" pediatric="" per="" ranged="" receive="" received="" reported="" season="" seasonal="" since="" subtyped="" that="" the="" through="" to="" total="" unpublished="" vaccination="" vaccine="" virus="" was="" were="" when="" who="" with="" years.="" years="">

Reported by

World Health Organization Collaborating Center for Surveillance, Epidemiology, and Control of Influenza. Lenee Blanton, MPH, Scott Epperson, MPH, Lynnette Brammer, MPH, Krista Kniss, MPH, Desiree Mustaquim, MPH, Craig Steffens, MPH, Alejandro Perez, MPH, Sandra S. Chaves, MD, Teresa Wallis, MS, Julie Villanueva, PhD, Xiyan Xu, MD, Lyn Finelli, DrPH, Anwar Isa Abd Elal, BScCS, Larisa Gubareva, PhD, Joseph Bresee, MD, Alexander Klimov, PhD, Nancy Cox, PhD, Influenza Div, National Center for Immunization and Respiratory Diseases, CDC. Corresponding contributor: Lenee Blanton, lblanton@cdc.gov, 404-639-3747.

Editorial Note

The 2012–13 influenza season began early, and influenza activity remained elevated across the United States as of February 9, 2013; during the most recent weeks, decreases have been observed in the South and East, while increases have continued in the West. Although the timing of influenza activity is not predictable, substantial activity can occur as late as May (2). During September 30, 2012–February 9, 2013, influenza A (H3N2) viruses were identified most frequently, followed by influenza B viruses, but a small number of pH1N1 viruses also were reported. Antigenic characterization of influenza-positive respiratory specimens submitted to CDC indicated that the majority of these specimens were like the 2012–13 influenza vaccine components. As of February 9, 2013, more than half of influenza-associated hospitalizations were reported to have occurred in adults aged ≥65 years, and rates of influenza-associated hospitalization among adults aged ≥65 years increased sharply from late December through January. The weekly percentage of deaths attributed to P&I was above the epidemic threshold beginning early in January, with the majority of the P&I deaths occurring in adults aged ≥65 years.
In the past, higher overall and age-specific rates of hospitalization and mortality have been observed during influenza A (H3N2)–predominant seasons (3,4). Based on FluSurv-Net surveillance data for the 2012–13 season to date, rates of influenza-associated hospitalizations are highest among adults aged ≥65 years, followed by children aged 0–4 years. This trend is similar to that observed in the 2007–08 and 2010–11 influenza seasons, during which influenza A (H3N2) viruses predominated. The number and rate of influenza-associated hospitalizations among adults aged ≥65 years during the 2012–13 influenza season is the highest since data collection on laboratory-confirmed influenza-associated hospitalization in adults began in the 2005–06 season.
Vaccination remains the first and best way to prevent influenza and its complications. Health-care providers should continue to offer vaccine to all unvaccinated persons aged ≥6 months throughout the influenza season. Interim vaccine effectiveness estimates suggest that effectiveness against influenza A (H3N2) viruses is lower and not statistically significant in adults aged ≥65 years during the 2012–13 influenza season (5). Adults aged ≥65 years are at the greatest risk for hospitalization and death from influenza-associated complications; therefore, it is important for them to receive their annual influenza vaccine, take everyday preventive actions, and seek medical care quickly if they develop ILI symptoms to see if treatment with antiviral medications is needed. Antiviral medications remain an important adjunct to vaccination for reducing the health impact of influenza. Recommended antiviral medications are oseltamivir and zanamivir. Early and aggressive treatment with antiviral medication is crucial, ideally within the first 48 hours of illness onset, and persons with suspected influenza infection who are at high risk, including adults aged ≥65 years, should be treated with antiviral medications without the need to wait for laboratory confirmation of influenza (6). However, as indicated by observational studies, antiviral treatment might still be beneficial in patients with severe, complicated, or progressive illness and in hospitalized patients when started after 48 hours of illness onset (6). Recent data on influenza antiviral resistance indicate that >99% of currently circulating influenza virus strains are sensitive to these medications.
Influenza surveillance reports for the United States are posted online weekly and are available at http://www.cdc.gov/flu/weekly. Additional information regarding influenza viruses, influenza surveillance, influenza vaccine, influenza antiviral medications, and novel influenza A infections in humans is available at http://www.cdc.gov/flu.

Acknowledgments

Participating state, city, county, and territorial health departments and public health laboratories; U.S. World Health Organization collaborating laboratories; the National Respiratory and Enteric Virus Surveillance System collaborating laboratories; the U.S. Outpatient Influenza-Like Illness Surveillance Network; the Influenza Hospitalization Surveillance Network; the Influenza-Associated Pediatric Mortality Surveillance System; and the 122 Cities Mortality Reporting System.

References

  1. CDC. Update: influenza activity—United States, September 30–November 24, 2012. MMWR 2012;61:990–3.
  2. CDC. Prevention and control of influenza with vaccines: recommendations of the Advisory Committee on Immunization Practices (ACIP). MMWR 2010;59(No. RR-8).
  3. Dao CN, Kamimoto L, Nowell M, et al. Adult hospitalizations for laboratory-positive influenza during the 2005–2006 through 2007–2008 seasons in the United States. J Infect Dis 2010;202:881–8.
  4. Thompson WW, Shay DK, Weintrab E, et al. Mortality associated with influenza and respiratory syncytial virus in the United States. JAMA 2003;289:179–86.
  5. CDC. Interim adjusted estimates of seasonal influenza vaccine effectiveness—United States, February 2013. MMWR 2013;62:120–4.
  6. CDC. Antiviral agents for the treatment and chemoprophylaxis of influenza: recommendations of the Advisory Committee on Immunization Practices (ACIP). MMWR 2011;60(No. RR-1).


* The CDC influenza surveillance system collects five categories of information from eight data sources: 1) viral surveillance (U.S. World Health Organization collaborating laboratories, the National Respiratory and Enteric Virus Surveillance System, and novel influenza A virus case reporting); 2) outpatient illness surveillance (U.S. Outpatient Influenza-Like Illness Surveillance Network); 3) mortality (122 Cities Mortality Reporting System and influenza-associated pediatric mortality reports); 4) hospitalizations (FluSurv-NET, which includes the Emerging Infections Program and surveillance in five additional states); and 5) summary of the geographic spread of influenza (state and territorial epidemiologist reports).
Defined as a temperature ≥100°F (≥37.8°C), oral or equivalent, and cough or sore throat, without a known cause other than influenza.
§ The national and regional baselines are the mean percentage of visits for ILI during noninfluenza weeks for the previous three seasons plus two standard deviations. Noninfluenza weeks are defined as periods of 2 or more consecutive weeks in which each week accounted for less than 2% of the season's total number of specimens that tested positive for influenza. National and regional percentages of patient visits for ILI are weighted on the basis of state population. Use of the national baseline for regional data is not appropriate.
The 10 regions include the following jurisdictions: Region 1: Connecticut, Maine, Massachusetts, New Hampshire, Rhode Island, and Vermont; Region 2: New Jersey, New York, Puerto Rico, and the U.S. Virgin Islands; Region 3: Delaware, District of Columbia, Maryland, Pennsylvania, Virginia, and West Virginia; Region 4: Alabama, Florida, Georgia, Kentucky, Mississippi, North Carolina, South Carolina, and Tennessee; Region 5: Illinois, Indiana, Michigan, Minnesota, Ohio, and Wisconsin; Region 6: Arkansas, Louisiana, New Mexico, Oklahoma, and Texas; Region 7: Iowa, Kansas, Missouri, and Nebraska; Region 8: Colorado, Montana, North Dakota, South Dakota, Utah, and Wyoming; Region 9: Arizona, California, Hawaii, Nevada, American Samoa, Commonwealth of the Northern Mariana Islands, Federated States of Micronesia, Guam, Marshall Islands, and Republic of Palau; and Region 10: Alaska, Idaho, Oregon, and Washington.
** Activity levels are based on the percentage of outpatient visits in a state attributed to ILI and are compared with the average percentage of ILI visits that occur during weeks with little influenza virus circulation. Activity levels range from minimal, which would correspond to ILI activity from outpatient clinics being at or below the average, to high, which would correspond to ILI activity from outpatient clinics being much higher than the average.
†† Levels of activity are 1) no activity; 2) sporadic: isolated laboratory-confirmed influenza cases or a laboratory-confirmed outbreak in one institution, with no increase in activity; 3) local: increased ILI, or at least two institutional outbreaks (ILI or laboratory-confirmed influenza) in one region of the state, with recent laboratory evidence of influenza in that region; virus activity no greater than sporadic in other regions; 4) regional: increased ILI activity or institutional outbreaks (ILI or laboratory-confirmed influenza) in at least two but less than half of the regions in the state with recent laboratory evidence of influenza in those regions; and 5) widespread: increased ILI activity or institutional outbreaks (ILI or laboratory-confirmed influenza) in at least half the regions in the state, with recent laboratory evidence of influenza in the state.
§§ FluSurv-NET conducts population-based surveillance for laboratory-confirmed influenza-associated hospitalizations in children aged <18 10="" 2003="" 2005="" 2009="" 2010="" 2011="" 2012="" 80="" a="" actual="" additional="" adults="" aged="" alifornia="" an="" and="" approximately="" are="" area.="" as="" because="" began="" calculated="" cases="" catchment="" cdc="" center="" clinical="" clinician-ordered="" colorado="" confirmation="" connecticut="" consequence="" counties="" covers="" dakota="" dependent="" diagnosis="" during="" emerging="" enhance="" estimates="" flusurv-net="" for="" georgia="" greater="" h1n1="" health="" hospitalization="" hospitalized="" idaho="" identified="" ihsp="" in="" incidence="" included="" infections="" influenza.="" influenza="" iowa="" is="" island="" laboratory="" likely="" maryland="" mexico="" michigan="" minnesota="" national="" new="" number="" of="" often="" ohio="" oklahoma="" on="" oregon="" p="" pandemic.="" part="" persons="" poor="" population="" program="" project="" rapid="" rates="" reliability="" reliance="" results="" rhode="" s="" season.="" season="" since="" sites="" south="" states.="" states="" statistics="" surveillance="" tennessee="" test="" testing="" the="" to="" underestimation="" underutilized="" using="" utah="" with="" years="" york="">
¶¶ Persons at higher risk include children aged <5 2="" adults="" after="" aged="" alone="" american="" and="" are="" as="" aspirin="" asthma="" body="" brain="" by="" cardiovascular="" caused="" cell="" cerebral="" chronic-care="" chronic="" conditions="" cord="" delay="" delivery="" developmental="" diabetes="" disability="" disease="" disorders="" dystrophy="" epilepsy="" especially="" except="" facilities.="" hematologic="" hepatic="" homes="" human="" hypertension="" i.e.="" immunodeficiency="" immunosuppression="" including="" index="" indian="" infection="" injury="" intellectual="" laska="" long-term="" mass="" medications="" mellitus="" mental="" metabolic="" moderate="" morbidly="" muscle="" muscular="" natives="" nerve="" neurodevelopment="" neurologic="" nursing="" obese="" of="" or="" other="" p="" palsy="" peripheral="" persons="" postpartum="" pregnant="" pulmonary="" receiving="" renal="" residents="" retardation="" seizure="" severe="" sickle="" spinal="" stroke="" such="" that="" the="" therapy="" those="" to="" virus="" weeks="" who="" with="" within="" women="" years="">
*** The seasonal baseline proportion of P&I deaths is projected using a robust regression procedure in which a periodic regression model is applied to the observed percentage of deaths from P&I that were reported by the 122 Cities Mortality Reporting System during the preceding 5 years. The epidemic threshold is set at 1.645 standard deviations above the seasonal baseline.


What is already known on this topic?
CDC collects, compiles, and analyzes data on influenza activity year-round in the United States. The timing and severity of circulating influenza viruses can vary by geographic location and season.
What is added by this report?
Influenza activity in the United States began to increase in mid-November and remained elevated through February 9, 2013. During September 30, 2012–February 9, 2013, of 55,470 influenza viruses tested, 79% were influenza A, and 19% were influenza B. Of 29,914 influenza A viruses that were subtyped, 97% were H3N2, and 3% were pH1N1. The age group with the highest hospitalization rate was ≥65 years, accounting for more than half of all reported influenza-associated hospitalizations.
What are the implications for public health practice?
Year-round influenza surveillance provides critical information for planning interventions to prevent and control influenza, developing vaccine recommendations and antiviral treatment guidance, and presenting information to the public regarding the progress and severity of the influenza season.


FIGURE 1. Number and percentage of respiratory specimens testing positive for influenza, by type, surveillance week, and year — U.S. World Health Organization and National Respiratory and Enteric Virus Surveillance System collaborating laboratories, United States, 2012–13 influenza season
The figure shows the number and percentage of respiratory specimens testing positive for influenza, by type, surveillance week, and year in the United States, during the 2012-13 influenza season, according to U.S. World Health Organization (WHO) and National Respiratory and Enteric Virus Surveillance System (NREVSS) collaborating laboratories. During September 30, 2012-February 9, 2013, approxi¬mately 140 WHO and NREVSS collaborat¬ing laboratories in the U.S. tested 203,706 respiratory specimens for influenza viruses; 55,470 (27.2%) were positive.
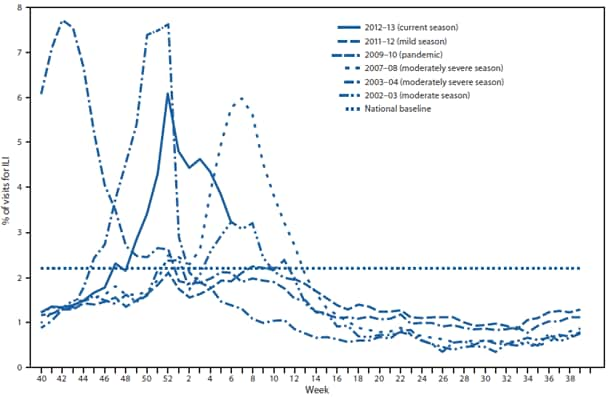
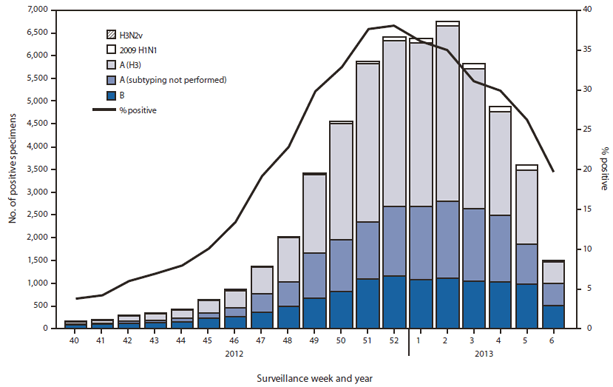
Alternate Text: The figure above shows the number and percentage of respiratory specimens testing positive for influenza, by type, surveillance week, and year in the United States, during the 2012-13 influenza season, according to U.S. World Health Organization (WHO) and National Respiratory and Enteric Virus Surveillance System (NREVSS) collaborating laboratories. During September 30, 2012-February 9, 2013, approxi¬mately 140 WHO and NREVSS collaborat¬ing laboratories in the U.S. tested 203,706 respiratory specimens for influenza viruses; 55,470 (27.2%) were positive.


FIGURE 2. Percentage of visits for influenza-like illness (ILI) reported by the U.S. Outpatient Influenza-Like Illness Surveillance Network (ILINet), by surveillance week and year — United States, 2012–13 and selected previous influenza seasons*
The figure shows the percentage of visits for influenza-like illness reported by the U.S. Outpatient Influenza-Like Illness Surveillance Network (ILINet), by surveillance week and year in the United States during 2012-13 and selected previous influenza seasons. From the week ending November 24, 2012 (week 47) to February 9, 2013 (week 6), the percentage equaled or exceeded the national baseline of 2.2% for 12 consecutive weeks.
* Data as of February 16, 2013.
Alternate Text: The figure above shows the percentage of visits for influenza-like illness reported by the U.S. Outpatient Influenza-Like Illness Surveillance Network (ILINet), by surveillance week and year in the United States during 2012-13 and selected previous influenza seasons. From the week ending November 24, 2012 (week 47) to February 9, 2013 (week 6), the percentage equaled or exceeded the national baseline of 2.2% for 12 consecutive weeks.


FIGURE 3. Rates of hospitalization for laboratory-confirmed influenza, by age group and surveillance week — FluSurv-NET,* 2012–13 influenza season
The figure shows rates of hospitalization for laboratory-confirmed influenza, by age group and surveillance week, during the 2012-13 influenza season, according to  FluSurv-NET. The cumulative hospitalization rate (per 100,000 population) from October 1, 2012 to February 9, 2013, was 43.9 among children aged 0-4 years, 9.3 among children aged 5-17 years, 11.6 among adults 18-49 years, 29.4 among adults aged 50-64 years, and 146.2 among adults aged ≥65 years.
* FluSurv-NET conducts population-based surveillance for laboratory-confirmed influenza-associated hospitalizations in children aged <18 10="" 2003="" 2005="" 80="" additional="" adults="" aged="" alifornia="" and="" approximately="" colorado="" connecticut="" counties="" covers="" emerging="" flusurv-net="" georgia="" hospitalization="" in="" infections="" influenza="" island="" maryland="" mexico="" michigan="" minnesota="" new="" ohio="" oregon="" owa="" p="" program="" project="" rhode="" season="" since="" states="" surveillance="" tennessee="" the="" utah="" years="" york="">
Data as of February 16, 2013.
Alternate Text: The figure above shows rates of hospitalization for laboratory-confirmed influenza, by age group and surveillance week, during the 2012-13 influenza season, according to FluSurv-NET. The cumulative hospitalization rate (per 100,000 population) from October 1, 2012 to February 9, 2013, was 43.9 among children aged 0-4 years, 9.3 among children aged 5-17 years, 11.6 among adults 18-49 years, 29.4 among adults aged 50-64 years, and 146.2 among adults aged ≥65 years.


FIGURE 4. Percentage of all deaths attributable to pneumonia and influenza (P&I), by surveillance week and year — 122 U.S. Cities Mortality Reporting System, United States, 2008–2013*
The figure shows the percentage of all deaths attributable to pneumonia and influenza, by surveillance week and year, during 2008-2013, according to the 122 U.S. Cities Mortality Reporting System. For the week ending February 9, 2013 (week 6), pneumonia and influenza (P&I) was reported as an underlying or contrib¬uting cause of death for 9.1% of all deaths reported to the 122 Cities Mortality Reporting System. This percentage is above the epidemic threshold of 7.5% for that week.
* For the reporting week ending February 9, 2013.
The epidemic threshold is 1.645 standard deviations above the seasonal baseline.
§ The seasonal baseline is projected using a robust regression procedure that applies a periodic regression model to the observed percentage of deaths from P&I during the preceding 5 years.
Alternate Text: The figure above shows the percentage of all deaths attributable to pneumonia and influenza, by surveillance week and year, during 2008-2013, according to the 122 U.S. Cities Mortality Reporting System. For the week ending February 9, 2013 (week 6), pneumonia and influenza (P&I) was reported as an underlying or contrib¬uting cause of death for 9.1% of all deaths reported to the 122 Cities Mortality Reporting System. This percentage is above the epidemic threshold of 7.5% for that week.


Use of trade names and commercial sources is for identification only and does not imply endorsement by the U.S. Department of Health and Human Services.

References to non-CDC sites on the Internet are provided as a service to MMWR readers and do not constitute or imply endorsement of these organizations or their programs by CDC or the U.S. Department of Health and Human Services. CDC is not responsible for the content of pages found at these sites. URL addresses listed in MMWR were current as of the date of publication.